Figures & data
Table 1 The Demographic and Clinical Features of the TP53 Wild Type and Mutation Hepatocellular Carcinoma Patients
Figure 1 The landscape of genomic alterations of HCC. (A) Somatic mutation landscape of the HCC cohort. Genes are arranged according to the frequency of mutations. (B) Dot plot of the HCC mutated genes enrichment analysis in the 10 oncogenic signaling pathways and the mutated fraction samples. (C) Mutual exclusive and co-occurring events among the top 20 high mutation frequency genes in HCC cohort, the blue indicates co−occurrence and the brown indicates mutually exclusive events. *p<0.05 is regarded significant.
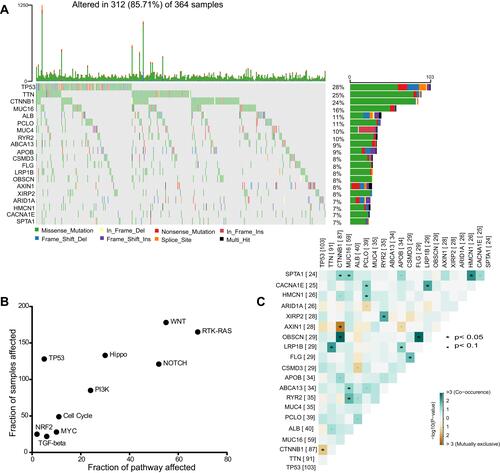
Figure 2 Overall survival analysis of TP53 in different pathological stage of HCC. Kaplan–Meier survival curve of overall survival of total (A), Stage I (B), Stage II (C) and Stage III (D) HCC patients in TP53 mutant or wild-type status.The light yellow line represents the mutant group and the light blue line represents the wild-type group.
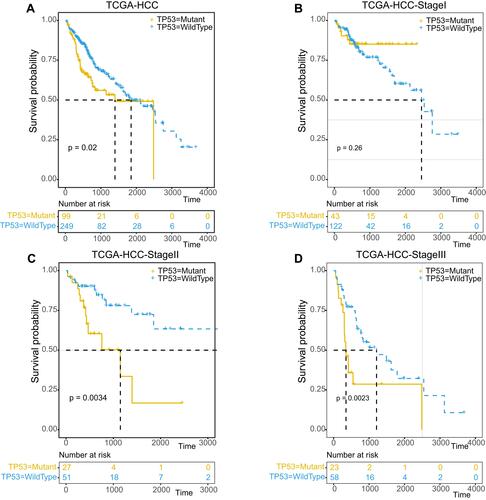
Figure 3 Gene differential expression profile in wild type and mutant HCC samples. (A and B) Volcano plot of mRNA (A) and lncRNA (B) expression profiles. Red dots represent up-regulated RNAs, green dots represent down-regulated RNAs, and black dots represent normal RNAs.(C and D) GSEA enrichment analysis of the misregulated genes in HCC, and the curve shows two representive functional enrichment categories. (E) Dot plot of the comparative GO enrichment analysis of the up-regulated and down-regulated genes (p<0.05, logFC≥1 or ≦-1).
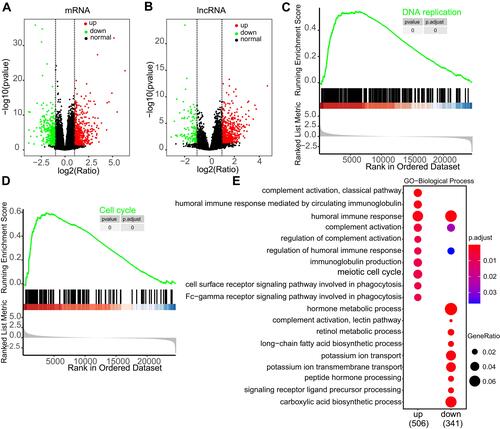
Figure 4 Immune cell infiltration landscape of TP53 wild type and mutation HCC patients. (A) Summary of estimated fractions of 22 immune cell subtypes from the CIBERSORT algorithm. Each Bar chart exhibits the cell proportions of each HCC patient. (B) Box plot of the differential abundance of 22 immune cells inTP53 wild type and mutation HCC patients. * indicates “p<0.05”, and ns indicates “not significant”.
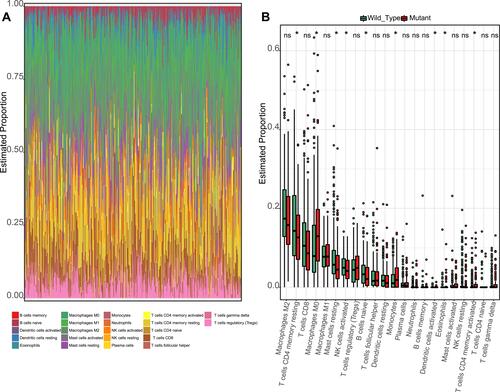
Figure 5 The TP53 ChIP-seq profile. (A) The peak count frequency of TP53 ChIP-seq peaks binding around transcription start site (TSS) regions (−3000_3000) of HepG2 cells. (B) Dot plot of the KEGG enrichment analysis of the TP53 ChIP-seq binding genes (−5000_3000 regions). (C) Genomic annotation of TP53 ChIP-seq peaks and their distribution percentage in different genomic regions of HepG2 cells.
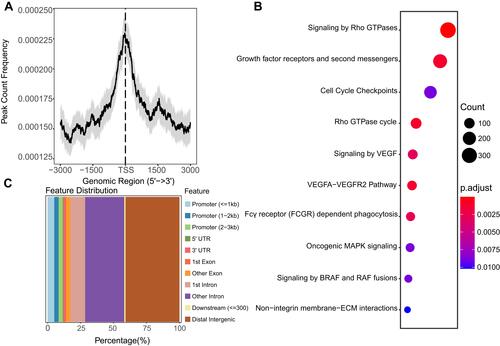
Figure 6 TP53 mutation related and directly regulated lncRNA prognosis markers in HCC. (A) Venn plot of the overlap lncRNAs of TP53 mutation related lncRNAs and TP53 directly regulated lncRNAs. (B) Venn plot of the TP53 mutation related lncRNAs and TP53 directly regulated lncRNAs that show clinical significance in total, TP53 wild type and TP53 mutation HCC patients by Kaplan–Meier survival analysis (p<0.05). (C–F) Kaplan–Meier survival curve and Time dependent ROC curve of RP4-736L20.3 and SNRK-AS1 in TP53 mutation HCC patients. (G–J) Kaplan–Meier survival curve and Time dependent ROC curve of RP4-736L20.3 and SNRK-AS1 in TP53 missense mutation HCC patients.
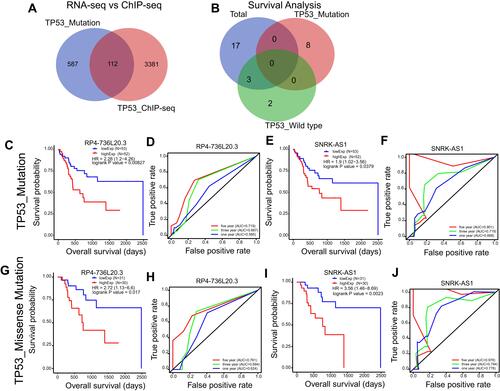
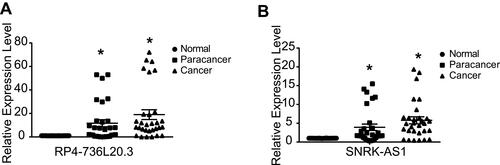
Figure 7 The differential expression of RP4-736L20.3 (A) and SNRK-AS1 (B) in HCC patients. Dot plot of the RT-qPCR results of RP4-736L20.3 and SNRK-AS1 in HCC patients’ normal, paracancer and cancer samples. *p<0.05 is regarded significant.