Figures & data
Table 1 The Demographic Characteristics of 42 Gastric Cancer Patients in the Discovery Cohort
Figure 1 The genetic alterations in gastric cancer patients. (A) The co-mutation plot of the top 30 mutated genes from the discovery gastric cancer patient cohort was illustrated and the genes were ranked based on their mutational frequency. CNV: copy-number variation; SV: structural variation. (B) Lollipop plot for TP53 mutations identified in the discovery gastric cancer patient cohort (upper panel) or the validation gastric cancer patient cohort (lower panel).
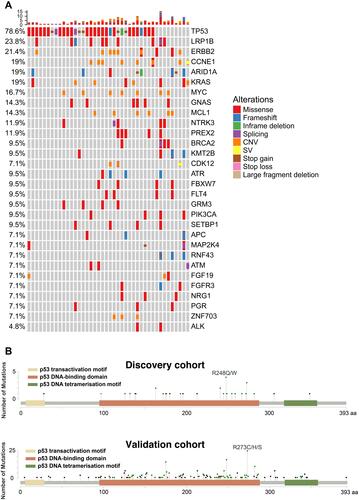
Figure 2 Cross-validated TP53 co-occurring or mutually exclusive genetic alterations in gastric cancer. (A–C) Co-mutation plot of TP53 mutations with BRCA1/BRCA2 mutations (A), KMT2B mutations (B), or microsatellite stability status (C) in the discovery patient cohort (upper panel) or the validation patient cohort (lower panel). For the validation patient cohort, only the samples with known BRCA1/BRCA2/KMT2B mutation status or microsatellite stability status were included in the analysis.
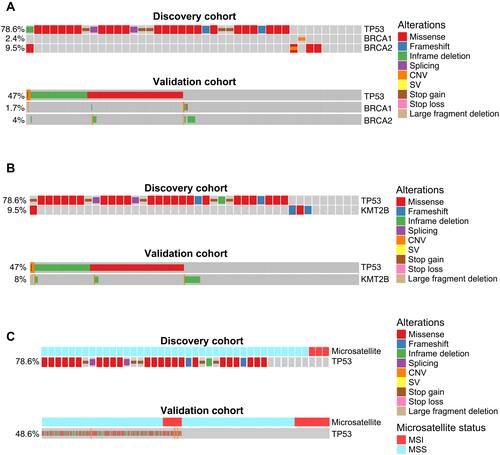
Table 2 The Sensitivity, Specificity, and Accuracy of Various p53 IHC Antibodies
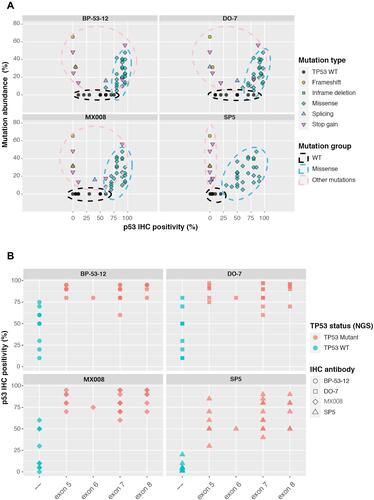
Figure 3 Characterizing different p53 IHC antibodies. (A) The relationship between the TP53 mutated allele frequency and p53 IHC positivity for 4 commonly used p53 antibodies, including SP5, MX008, BP-53-12, and DO-7. Each dot represents a TP53 genetic change from the 42-patient cohort. (B) p53 IHC positivity in different TP53 exon regions for the 4 tested p53 IHC antibodies. Based on the NGS results, TP53 WT samples were shown in green while samples harboring TP53 missense mutations were shown in red. WT, wild type.