Figures & data
Table 1 IC50 Values of 18β-Gly and 5-FU in Lung Cancer Cells
Figure 1 Cytotoxic effects of 18β-Gly on human lung cancer cells. (A) A549, NCI-H23, and NCI-H460 lung cancer cells were treated with different concentrations of 18β-Gly (10, 20, 30, 40, and 50 μM) for 24 h, after which their cell viabilities were determined by the CCK-8 assay. (B) IMR-90, GES-1, and 293T normal cells were treated with different concentrations of 18β-Gly (10, 20, 30, 40, and 50 μM) for 24 h, after which their cell viabilities were determined by the CCK-8 assay. (C) A549, NCI-H23, and NCI-H460 cells were treated at different time points (6, 12, 24, and 36 h) with IC50 of 18β-Gly, after which their cell viabilities were determined by the CCK-8 assay. (D) IMR-90, GES-1 and 293T cells were treated at different time points (6, 12, 24, and 36 h) with IC50 of 18β-Gly, after which their cell viabilities were determined by the CCK-8 assay. Data are expressed as the means ± SDs. *P < 0.05, **P < 0.01, ***P < 0.001 vs control.
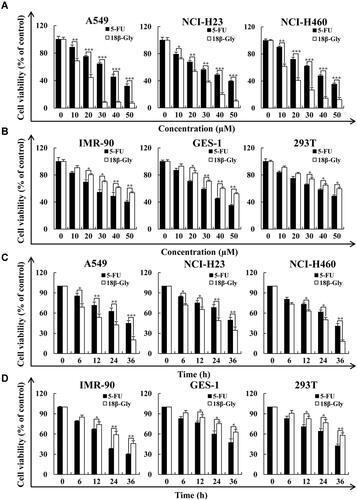
Figure 2 Apoptotic effects of 18β-Gly on A549 cells. (A) A549 cells were double stained with Hoechst 33342 and PI, and the fluorescence intensities and morphology changes were observed under a fluorescence microscope (original magnification, 200×). (B) Percentage of apoptotic cells was detected by flow cytometry. (C) Mitochondrial morphology was observed by an electron microscope, the morphological changes of mitochondria occurred at the arrow marks. (D) The MMP was detected by FCM. (E) The protein expression levels were measured by Western blotting after treatment of A549 cells with 18β-Gly. The percentage of apoptotic cells represents the means ± SDs. β-actin served as the loading control. **P < 0.01, ***P < 0.001 vs 0 h.
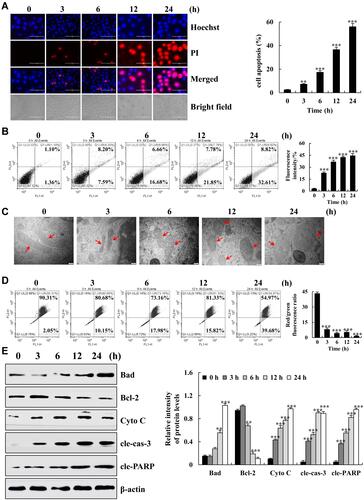
Figure 3 Effects of 18β-Gly on MAPK/STAT3/NF-κB signaling pathways in A549 cells. (A) Expression levels of p-p38, p-JNK, p-ERK, p-STAT3, NF-κB, and IκB-α were measured by Western blotting. (B) Expression levels of STAT3, NF-κB, and p-IκB in the nucleus were measured by Western blotting. (C) Expression levels of p-p38, p-STAT3, Bcl-2, cle-cas-3, and cle-PARP proteins in 18β-Gly and p38 inhibitor-treated A549 cells. (D) Expression levels of p-JNK, p-STAT3, Bcl-2, cle-cas-3, and cle-PARP proteins in 18β-Gly and JNK inhibitor-treated A549 cells. (E) Expression levels of p-ERK, p-STAT3, Bcl-2, cle-cas-3, and cle-PARP proteins in 18β-Gly- and ERK inhibitor-treated A549 cells. β-actin and Lamin B1 were served as the loading controls. *P < 0.05, **P < 0.01, ***P < 0.001 vs 0 h or 18β-Gly + MAPK inhibition.
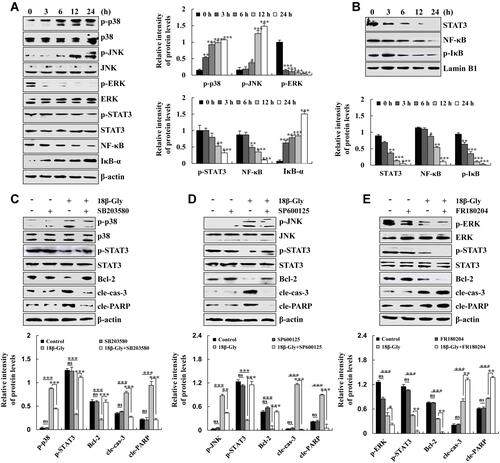
Figure 4 Effects of 18β-Gly on ROS generation and inducing apoptosis of A549 cells. (A) A549 cells were treated with 18β-Gly, and intracellular ROS levels were measured by FCM. (B) IMR-90 normal cells were treated with 18β-Gly, and intracellular ROS levels were measured by FCM. (C) A549 cells were treated with NAC and 18β-Gly. Then the percentage of apoptotic cells was detected by FCM. (D) A549 cells were treated with NAC and 18β-Gly. Next, mitochondrial morphology was observed by a transmission electron microscope, the morphological changes of mitochondria occurred at the arrow marks. (E) A549 cells were treated with 18β-Gly and NAC, after which the expression levels of MAPKs, STAT3, NF-κB, cle-cas-3, and cle-PARP were detected by Western blotting. β-actin was used as the loading control. ns, not significant, *P < 0.05, **P < 0.01, ***P < 0.001 vs 0 h or the NAC + 18β-Gly group.
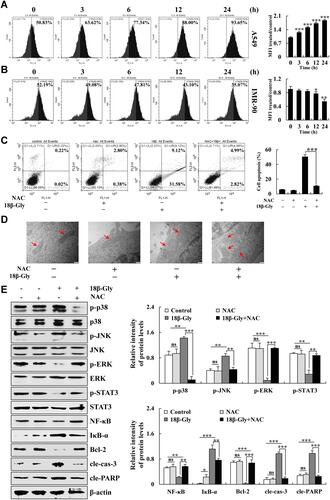
Figure 5 Effects of 18β-Gly on the cell cycle in A549 cells. (A) The percentage of cell cycle as detected by FCM. (B) Expression levels of G2/M cell cycle-related proteins cyclin B1, CDK1/2, p21, and p27 were examined by Western blotting after treatment with 18β-Gly. (C) A549 cells were treated with NAC and 18β-Gly, and then the percentage of cell cycle was detected by flow cytometry. (D) A549 cells were treated with 18β-Gly and NAC, after which the expression levels of cyclin B1, CDK1/2, p21, and p27 were detected by Western blotting. β-actin was used as the loading control. ns, not significant, *P < 0.05, **P < 0.01, ***P < 0.001 vs 0 h or the NAC + 18β-Gly group.
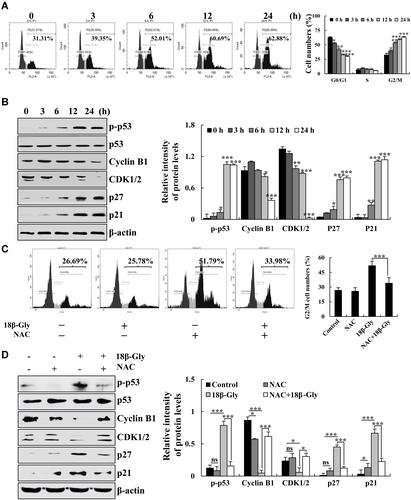
Figure 6 Effects of 18β-Gly on cell migration in A549 cells. (A) Transwell migration assay detects cell migration. (B) Cell migration was observed by an inverted microscope. (C) Expression levels of E-cadherin, N-cadherin, vimentin, and SNAI 1 were examined by Western blotting after treatment with 18β-Gly. (D) A549 cells were treated with NAC and 18β-Gly, and then cell migration were observed by an inverted microscope. (E) A549 cells were treated with 18β-Gly and NAC, after which the expression levels of E-cadherin, N-cadherin, vimentin, and SNAI 1 were detected by Western blotting. (F) A549 cells were treated with 18β-Gly and SB203580, after which the expression levels of E-cadherin, N-cadherin, vimentin, and SNAI 1 were detected by Western blotting. (G) A549 cells were treated with 18β-Gly and SP600125, after which the expression levels of E-cadherin, N-cadherin, vimentin, and SNAI 1 were detected by Western blotting. (H) A549 cells were treated with 18β-Gly and FR180204, and the expression levels of E-cadherin, N-cadherin, Vimentin, and SNAI 1 were detected by Western blotting. β-actin was used as the loading control. ns, not significant, *P < 0.05, **P< 0.01, ***P < 0.001 vs 0 h or the NAC + 18β-Gly group.
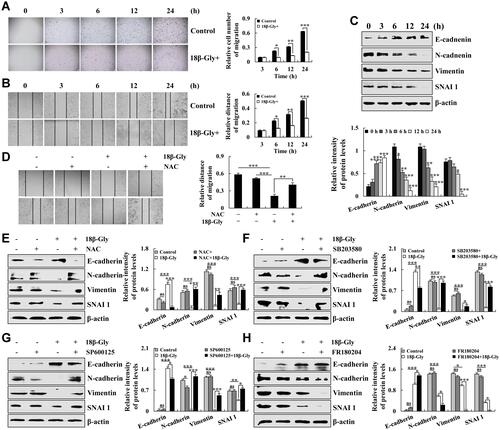
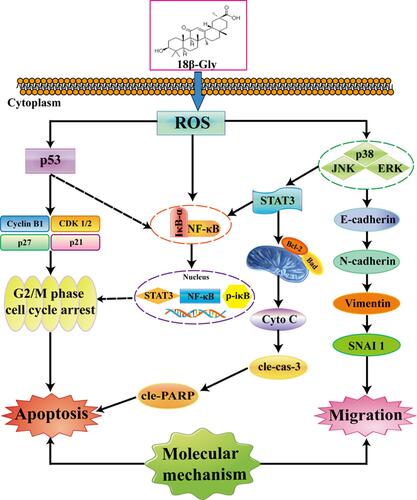
Figure 7 Mechanisms underlying the anti-cancer effects of 18β-Gly on A549 human lung cancer cells.