Figures & data
Figure 1 The expression of circPTCH1 in lung cancer. (A) The circRNA expression profile in five lung cancer tissues and five matched lung tissues by high-throughput sequencing. (B) QRT-PCR analysis of the expression levels of circPTCH1 in lung cancer tissues compared with normal tissues. (C) The expression levels of circPTCH1 in lung cancer tissues with lymph node metastasis compared with those without metastasis. (D) QRT-PCR analysis of the expression levels of circPTCH1 in lung cancer cells (A549, NCI-H1299, SK-MES-1, and NCI-H661) and BEAS-2B. (E) The schematic diagram of convergent primers and divergent primers to amplify linear and circPTCH1 by cDNA and gDNA by RT-PCR, and below is the result of agarose gel electrophoresis after qRT-PCR, respectively. (F) QRT-PCR analysis of the expression of circPTCH1 and mRNA PTCH1 after RNase R treatment. (G, H) The distribution of circPTCH1 and mRNA PTCH1 in the nuclear and cytoplasmic fractions of A549 and SK-MES-1 cells. U6 was used for nuclear fraction positive control, GAPDH was used for cytoplasmic fraction positive control. Data represent mean ± SD. **P < 0.01, ***P < 0.001 compare with negative control.
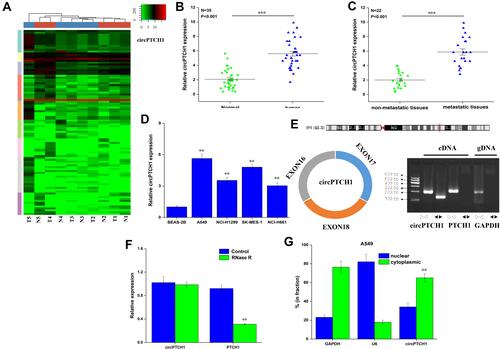
Figure 2 circPTCH1 regulates lung cancer cells migration, invasion. (A) QRT-PCR assay showed si-circPTCH1 could significantly decreased the expression of circPTCH1 and not significantly effect mRNA PTCH1 level in A549 and SK-MES-1 cells. (B, C) Wound healing assays showed that circPTCH1 knockdown significantly suppressed migration A549 and SK-MES-1 cells. (D, E) transwell assays showed that circPTCH1 knockdown significantly suppressed migration A549 and SK-MES-1 cells. (F) RT-PCR assay showed overexpression circPTCH1 plasmid could significantly decreased the expression of circPTCH1 and not significantly effect mRNA PTCH1 level in A549 and SK-MES-1 cells. (G–J) Cell migration and invasion abilities of A549 and SK-MES-1 transfected with circPTCH1 or vector were assessed by Wound healing and transwell assays. Data represent mean ± SD. **P < 0.01 compare with negative control.
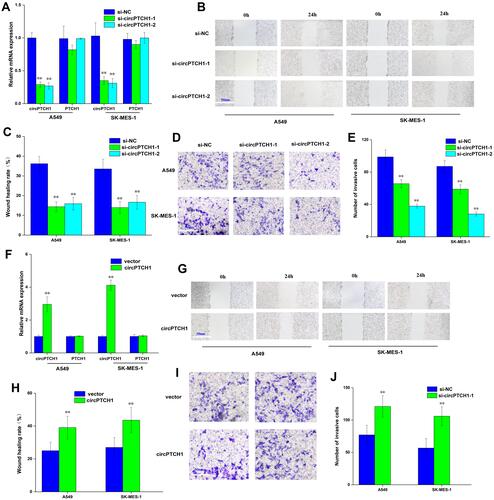
Figure 3 CircPTCH1 acts as a sponge for miR-34c-5p. (A) bioinformatic analysis to search for miR-34c-5p interact with circPTCH1-MUT or circPTCH1-WT. (B, C) The efficiency of circPTCH1 probe was validated by qRT-PCR and gel electrophoresis. (D) The expression of 2 miRNAs pulled down by circPTCH1 in A549 and SK-MES-1 cells were determined by RT-qPCR. (E) The luciferase activity of circPTCH1 WT or MUT in A549 cells cotransfected with miR-34c-5p (F) Relative circPTCH1 level in HEK293T cells lysates captured by biotin-labeled miR-34c-5p or NC was detected by qRT-PCR. (G) QRT-PCR analysis of expression levels of miR-34c-5p in A549 and SK-MES-1 cells transfected with circPTCH1 overexpression or si-circPTCH1-2 or negative control. (H) QRT-PCR analysis of the expression levels of miR-34c-5p in lung cancer tissues compared with normal tissues. (I) Pearson correlation was used for correlation analysis between circPTCH1 and miR-34c-5p in lung cancer patients. (J) The colocalization ratio of circPTCH1 and miR-34c-5p in A549 cells by FISH. Data represent mean ± SD. **P < 0.01 compare with negative control.
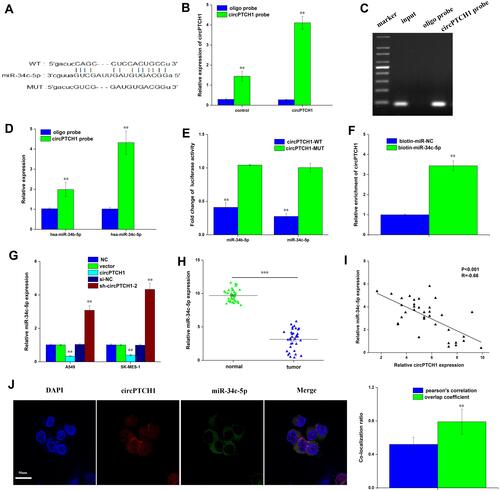
Figure 4 MYCN is a direct target of miR-34c-5p in lung cancer cell. (A) bioinformatic analysis to search for MYCN interact with miR-34c-5p-MUT or miR-34c-5p-WT. (B) QRT-PCR analysis of the expression levels of MYCN in lung cancer cells (A549, SK-MES-1) and BEAS-2B. (C) QRT-PCR analysis of the expression levels of MYCN in lung cancer tissues compared with normal tissues. (D) Pearson correlation was used for correlation analysis between MYCN and miR-34c-5p in lung cancer patients. (E) The luciferase activity of miR-34c-5p WT or MUT in A549 cells cotransfected with MYCN (F) QRT-PCR analysis of the expression levels of MYCN transfected with miR-34c-5p mimic or miR-34c-5p mimic+NC or miR-34c-5p mimic+MYCN in A549 and SK-MES-1 cells. (G, H) Cell migration and invasion abilities of A549 and SK-MES-1 transfected with miR-34c-5p mimic or miR-34c-5p mimic+NC or miR-34c-5p mimic+MYCN by Wound healing and transwell assays in A549 and SK-MES-1 cells. Data represent mean ± SD. **P < 0.01 compare with negative control.
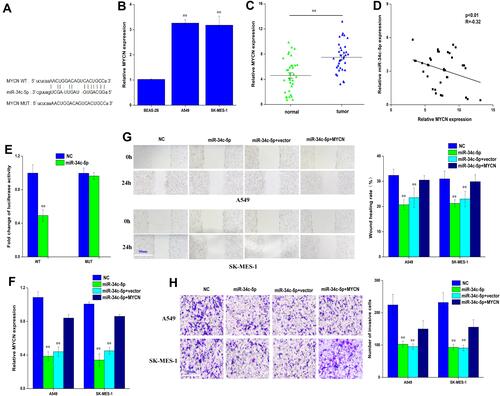
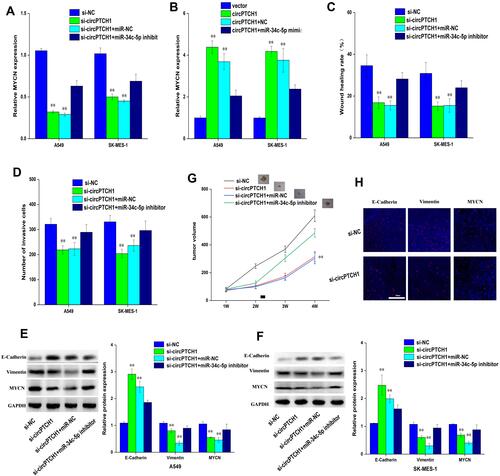
Figure 5 CircPTCH1 inhibits lung cancer cells migration, invasion and EMT by targeting MYCN via miR-34c-5p. (A, B) QRT-PCR analysis of the expression levels of MYCN in lung cancer cells after various treatments. (C, D) Wound healing and transwell assays showed the migration and invasion abilities of lung cancer cells after various treatments. (E, F) Western blot analysis the expression levels of MYCN, E-cadherin and Vimentin transfected with various treatments in A549 and SK-MES-1 cells. Data represent mean ± SD. **P < 0.01 compare with negative control. (G) BALB/c nude mice injected into A549 cells with various treatments. (H) E-cadherin, Vimentin, and MYCN in xenograft tumors were stained by immunofluorescent staining.