Figures & data
Table 1 The Cytokine Concentrations are as Follows
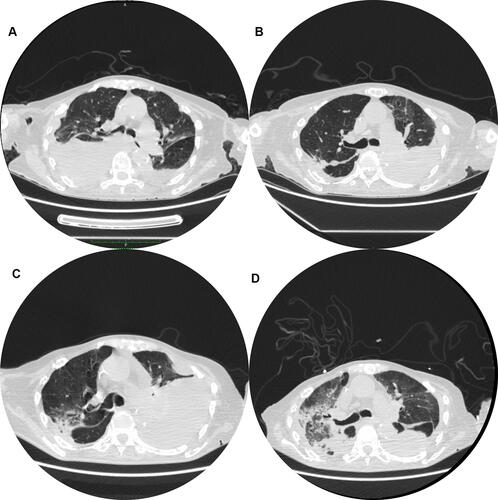
Figure 1 Changes in chest CT findings during the course of the disease. (A) Taken on 8 June 2020, Initial stage: Chest CT showed bilateral pleural effusion as well as left interlobar effusion and no manifestation of acute inflammation and space-occupying lesions. (B) Taken on 15 July 2020, Remission stage: slowly increasing tendency of the left pleural effusion and no increasing in right pleural effusion. (C) Taken on 17 August 2020, Relapse stage: obvious increase of left pleural effusion and decrease of right pleural effusion. (D) Taken on 3 September 2020, Terminal stage: Ground-glass opacity and consolidation in the right lung, diffuse ground-glass opacity in the left lung, the progression of lesions in upper lobe and decrease of bilateral pleural effusion.