Figures & data
Table 1 Association Between MCV, RDW and Clinicopathological Features of Skull Base Chordoma Patients
Figure 1 Levels of MCV and RDW were correlated with the prognosis of chordoma patients. (A and B) Distribution of MCV, RDW, recurrent status, survival status in 187 skull base chordoma patients. (C) Patients with lower MCV had shorter PFS and OS. (D) Patients with higher RDW had shorter PFS and OS.
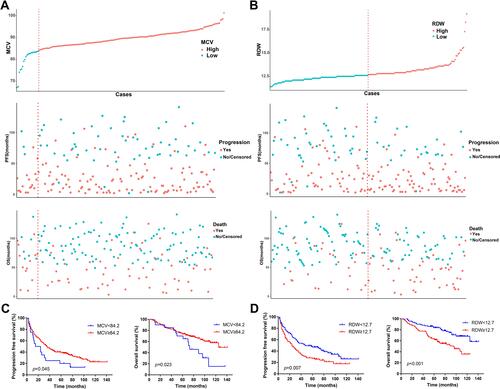
Figure 2 Kaplan–Meier curves of MCV or RDW in different pathological types of skull base chordoma patients. (A) PFS analysis of MCV in classical chordoma patients. (B) PFS analysis of MCV in chondroid chordoma patients. (C) OS analysis of MCV in classical chordoma patients. (D) OS analysis of MCV in chondroid chordoma patients. (E) PFS analysis of RDW in classical chordoma patients. (F) PFS analysis of RDW in chondroid chordoma patients. (G) OS analysis of RDW in classical chordoma patients. (H) OS analysis of RDW in chondroid chordoma patients.
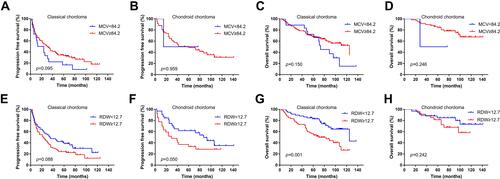
Table 2 Univariate and Multivariate Cox Analysis for PFS in Skull Base Chordoma
Table 3 Univariate and Multivariate Cox Analysis for OS in Skull Base Chordoma
Figure 3 Development of nomogram based on independent prognostic variables for survival prediction. (A) PFS prediction. (B) OS prediction.
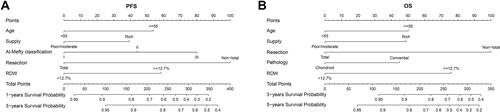
Figure 4 ROC curve of the nomogram and Al-mefty classification for survival prediction. (A) 1-year and 3-year PFS. (B) 3-year and 5-year OS.
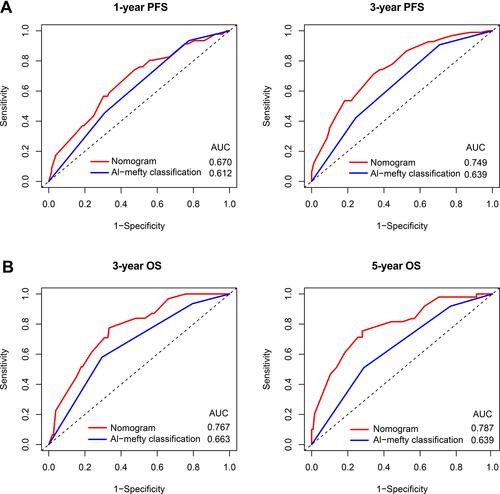
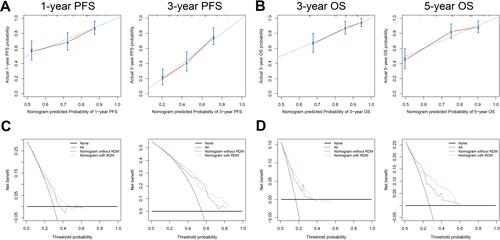
Figure 5 The nomogram showed adequate performance in survival prediction. The calibration curves indicated the agreement between the predicted and actual probability of PFS (A) and OS (B). The dashed blue line represents the actual probability of survival, the red dots and red lines represent the probability of survival predicted by the nomogram, and the solid blue lines represent the 95% confidence interval of the probability of survival predicted by the nomogram. Decision curve analysis of the nomogram for PFS (C) and OS (D).