
Figures & data
Table 1 Clinical Characteristics of the 250 CRC Patients
Figure 1 Representative IHC staining of CD163, Foxp3 and Smad3 in normal, paracancerous and CRC tissues (400× field). (A–C) The cell membrane and cytoplasm of M2-type macrophages are stained brown. (D–F) The nucleus of Tregs are stained brown. (G–I) The cell membrane and cytoplasm of Smad3+ cells are stained brown.
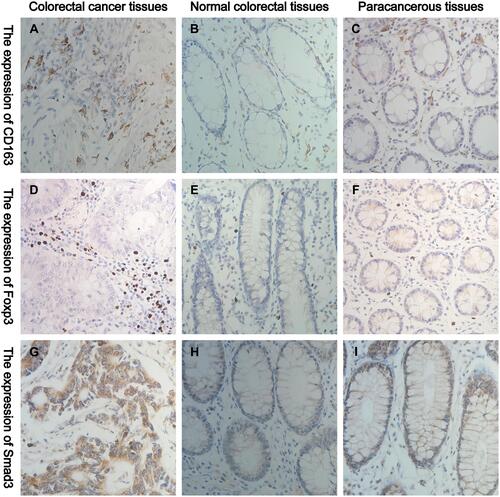
Figure 2 The expression levels of CD163, Foxp3 and Smad3 are different in normal, paracancerous and cancer tissues. (A) The number of CD163 in CRC tissues, their matched normal and paracancerous tissues. (B) The number of Foxp3 in CRC tissues, their matched normal and paracancerous tissues. (C) The staining indices of Smad3 in CRC tissues, their matched normal and paracancerous tissues.
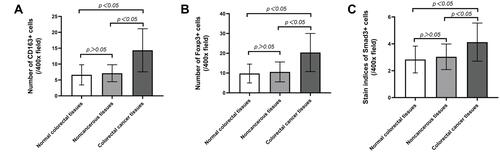
Table 2 Relationship Between CD163 and Foxp3 and Clinicopathological Characteristics
Figure 3 Representative IHC staining of CD163, Foxp3 and Smad3 in different tumour TNM staging (400× field). (A–D) The expression of CD163 in CRC at stages I, II, III and IV. (E–H) The expression of Foxp3 in CRC at stages I, II, III and IV. (I–L) The expression levels of Smad3 in CRC at stages I, II, III and IV. (M–O) The changing trend of CD163, Foxp3 and Smad3 in CRC in different tumour TNM staging.
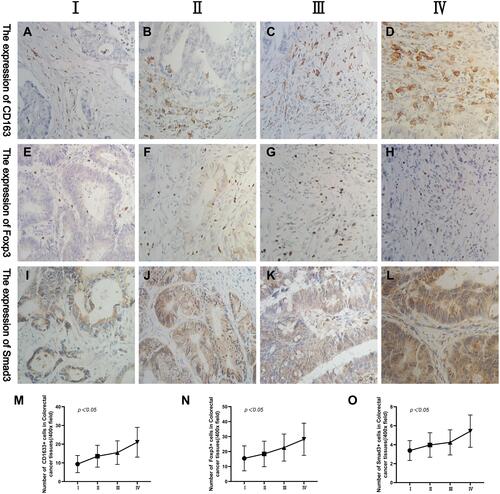
Table 3 Correlation Analysis of CD163 and Foxp3 Expression in Colorectal Cancer
Table 4 Correlation Analysis of Smad3 with CD163 and Foxp3 in Colorectal Cancer
Figure 4 Correlation analysis among CD163, Foxp3 and Smad3 in CRC. The linear correlation model is shown with a red line. Corresponding 95% confidence intervals (CI) are shown with the gray area. (A) Correlation between the number of CD163+ cells and Foxp3+ cells. (B) Correlation between the number of CD163+ cells and the staining indices of Smad3+ cells. (C) Correlation between the number of Foxp3+ cells and the staining indices of Smad3+ cells.
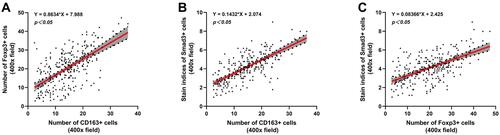
Table 5 Correlation Analysis of the Number of M2-Type Macrophages and Tregs with Preoperative CEA, CA19-9 and CA72-4