Figures & data
Table 1 Characteristics of the 106 patients with pediatric acute myeloid leukemia
Figure 1 MicroRNA-100 (miR-100) expression in 106 pediatric acute myeloid leukemia (AML) patients and normal controls.
Notes: After normalization to RNU6B expression levels, the expression level of miR-100 in the bone marrow of 106 pediatric AML patients (mean ± standard deviation [SD]: 10.8 ± 1.9) was significantly higher than that of normal controls (mean ± SD: 2.6 ± 0.7, P < 0.001). P-values were calculated using the Mann–Whitney U test.
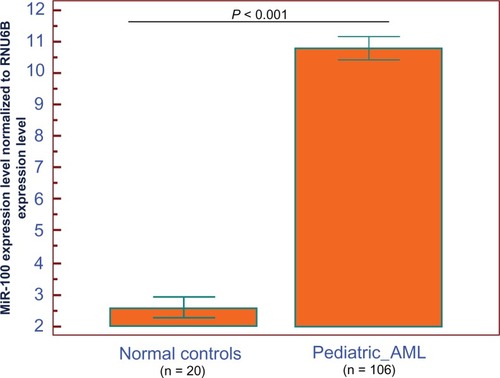
Figure 2 Kaplan–Meier curves of relapse-free survival (A) and overall survival (B) of pediatric patients with newly diagnosed acute myeloid leukemia (AML) stratified by the level of microRNA-100 (miR-100) expression.
Notes: High miR-100 expression was associated with shorter relapse-free (P = 0.008) and overall (P = 0.006) survival in pediatric AML patients.
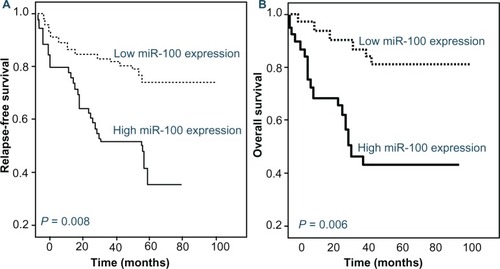
Table 2 Univariate analysis of the impact of variables on relapse-free and overall survival in pediatric acute myeloid leukemia patients
Table 3 Multivariate analysis of the impact of variables on relapse-free survival and overall survival in pediatric acute myeloid leukemia patients