Figures & data
Table 1 Demographic, biological and clinical features of the study patients stratified by stage, and comparison with the whole NB population diagnosed during the study period
Table 2 Concentration of each analyte in the entire cohort of study patients (N = 505) and in patients with localized disease (N = 288)
Figure 1 Kaplan–Meier plots of event-free survival of (A) patients with localized NB stratified by urinary VMA/HVA cut-off value; (B) patients with localized disease stratified by plasma VMA/HVA cut-off value; (C) the entire cohort of study patients stratified by ferritin cut-off value; (D) patients with stage 4 disease stratified by NSE cut-off value; (E) patients with localized disease stratified by LDH cut-off value; and (F) patients with stage 4 disease stratified by LDH cut-off value.
Abbreviations: HVA, homovanillic acid; LDH, lactate dehydrogenase; NB, neuroblastoma; NSE, neuron-specific enolase; VMA, vanillylmandelic acid.
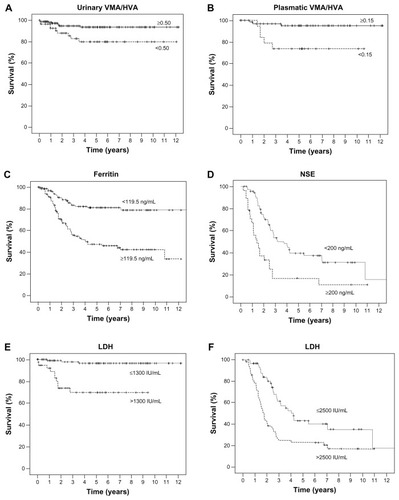
Table 3 Prognostic value of each marker in the different groups of neuroblastoma patients