Figures & data
Table 1 Clinicopathologic characteristics of patients included in the study
Figure 1 Overall survival of patients with non-small cell lung carcinoma in relation to γ-H2AX expression.
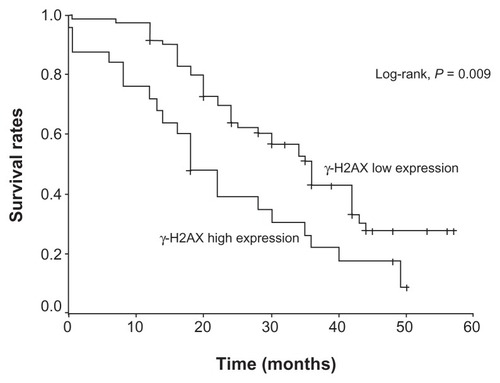
Table 2 Survival analysis according to clinicopathologic and histologic parameters
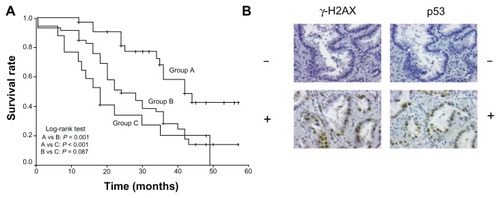
Figure 2 (A) Overall survival of patients with non-small cell lung carcinoma in relation to coexpression of p53 and γ-H2AX. Group A: p53 and γ-H2AX low-expression tumors. Group B: p53 high-/γ-H2AX low- or p53 low-/γ-H2AX high-expression tumors. Group C: p53 and γ-H2AX high-expression tumors. (B) Representative serial sections of adenocarcinomas immunostained for γ-H2AX and p53.