Figures & data
Table 1 Primers Sequences
Figure 1 Chidamide synergistically enhanced oxaliplatin-induced cytotoxicity in HCT-116 and RKO cells. (A) Cell viability curves of HCT-116 and RKO treated with 0.5 to 32 μM of chidamide or oxaliplatin for 48 h. (B) Cell viability curves of HCT-116 and RKO treated with different concentrations of chidamide (0 to 32 μM) combined with indicated concentrations of oxaliplatin (4 μM, 8 μM, and 32 μM) for 48 h, respectively. (C) The combination index (CI) values of different concentrations of chidamide with fixed concentrations of oxaliplatin were calculated via CompuSyn.
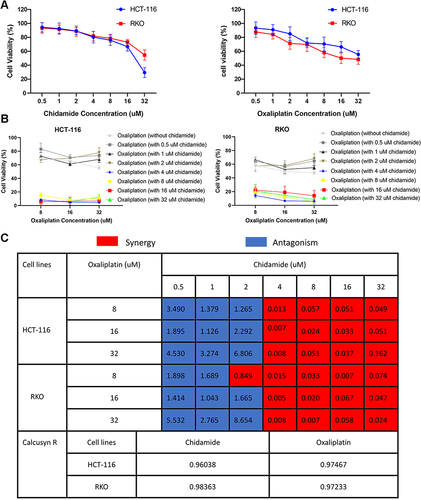
Figure 2 Chidamide enhanced oxaliplatin-induced proliferation inhibition and apoptosis in HCT-116 and RKO cells. (A) Colony formation analyzed the effects of chidamide and oxaliplatin monotherapy and the combined treatment on HCT-116 and RKO cell proliferation. (B) CCK-8 analyzed the effects of chidamide and oxaliplatin monotherapy and the combined treatment on HCT-116 and RKO cell viability. (C) Flow cytometry analyzed the effects of chidamide and oxaliplatin monotherapy and the combined treatment on HCT-116 and RKO cell apoptosis. *P<0.05, **P<0.01, ***P<0.001, ****P<0.0001.
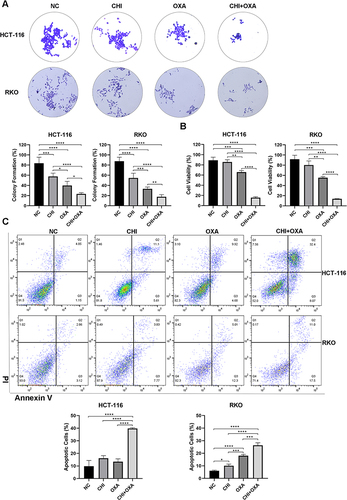
Figure 3 Chidamide significantly enhanced oxaliplatin-induced migratory and invasive abilities inhibition of HCT-116 and RKO cells. (A) Transwell assays analyzed the effects of chidamide and oxaliplatin monotherapy and the combined treatment on HCT-116 cell migration and invasion (×100 magnification). (B) Transwell assays analyzed the effects of chidamide and oxaliplatin monotherapy and the combined treatment on RKO cell migration and invasion (×100 magnification). (C) Wound-healing assays analyzed the effects of chidamide and oxaliplatin monotherapy and the combined treatment on HCT-116 and RKO cell migration. *P<0.05, **P<0.01, ***P<0.001, ****P<0.0001.
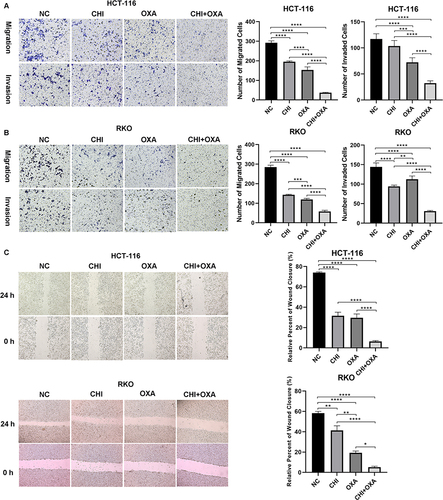
Figure 4 Transcriptomic sequencing of HCT-116 cells after different treatments and validation of the target gene. (A) The heatmap and Volcano map exhibited the DEGs in HCT-116 cells treated with oxaliplatin alone and chidamide plus oxaliplatin for 48 h. 116-C represents HCT-116 cells treated with 8 uM oxaliplatin. 116-D means HCT-116 cells treated with 4 uM chidamide plus 8 uM oxaliplatin. (B) The bubble plot and bar plot showed enriched pathways of DEGs between oxaliplatin monotherapy and the combined treatment via KEGG analysis. (C) The PPI network is composed of the top ten hub DEGs between oxaliplatin monotherapy and the combined treatment. The red gene ranked first and was followed by the Orange and yellow genes in order. (D) DEGs enriched in ribosome pathway. Red represented upregulation and green represented downregulation expression. (E) The RPS27A mRNA levels were quantified by RT-qPCR in HCT-116 and RKO cells treated with chidamide and oxaliplatin single agent and the combined treatment for 48 h. (F) The RPS27A protein levels were determined by WB in HCT-116 and RKO cells treated with chidamide and oxaliplatin single agent and the combined treatment for 48 h. *P<0.05, **P<0.01, ***P<0.001, ****P<0.0001.
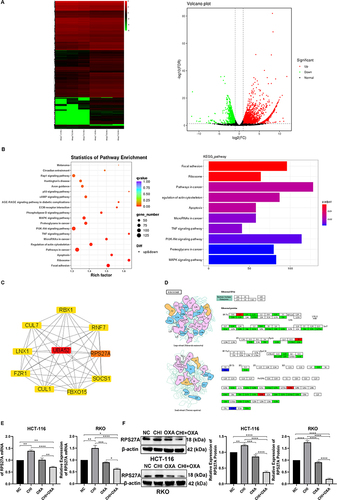
Figure 5 RPS27A was highly expressed in both CRC tissues and CRC cells. (A) RPS27A expression in HCT-116, RKO, and NCM-460 cells was quantified via RT-qPCR. (B) RPS27A expression in HCT-116, RKO, and NCM-460 cells was quantified via WB. (C) RPS27A expression in 30 CRC tissues and corresponding normal colorectal tissues were quantified via IHC. ***P<0.001, ****P<0.0001.
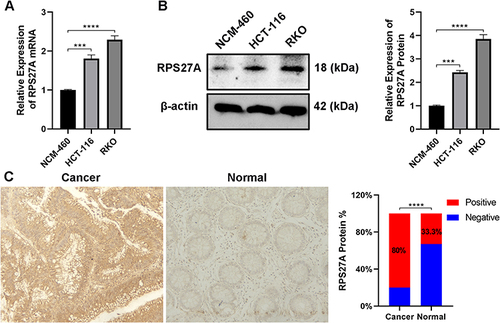
Figure 6 RPS27A knockdown inhibited CRC cell proliferation and promoted apoptosis via the MDM2-P53 pathway. (A) RPS27A mRNA expression was quantified by RT-qPCR in HCT-116 and RKO cells transfected with siRNAs targeted RPS27A. (B) RPS27A protein expression was determined by WB in HCT-116 and RKO cells transfected with siRNA-2 targeted RPS27A. (C) CCK-8 displayed the influence that RPS27A silence had on HCT-116 and RKO cell viability. (D) flow cytometry displayed the influence that RPS27A silence had on HCT-116 and RKO cell apoptosis. (E) MDM2 and P53 expression were quantified by RT-qPCR in HCT-116 and RKO cells transfected with siRNA which targeted RPS27A. (F) MDM2 and P53 expression was quantified by WB in HCT-116 and RKO cells transfected with siRNA which targeted RPS27A **P<0.01, ***P<0.001, ****P<0.0001.
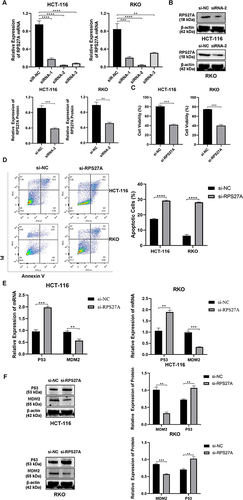
Figure 7 RPS27A overexpression partially reversed chidamide plus oxaliplatin exerted cell proliferation inhibition and apoptosis induction in HCT-116 and RKO cells. (A) RPS27A expression was quantified by RT-qPCR when HCT-116 and RKO cells were transfected with RPS27A overexpression plasmid. (B) RPS27A expression was quantified by WB when HCT-116 and RKO cells were transfected with RPS27A overexpression plasmid. (C) CCK-8 analyzed the influence that RPS27A overexpression had on HCT-116 and RKO cell viability when they were treated with chidamide plus oxaliplatin. (D) flow cytometry analyzed the influence that RPS27A overexpression had on HCT-116 and RKO cell apoptosis when they were treated with chidamide plus oxaliplatin. (E) MDM2 and P53 expression determined by RT-qPCR in HCT-116 and RKO cells transfected with RPS27A overexpression plasmid after the treatment of chidamide plus oxaliplatin for 48 h. (F) MDM2 and P53 expression determined by WB in HCT-116 and RKO cells transfected with RPS27A overexpression plasmid after the treatment of chidamide plus oxaliplatin for 48 h. *P<0.05, **P<0.01, ***P<0.001, ****P<0.0001.
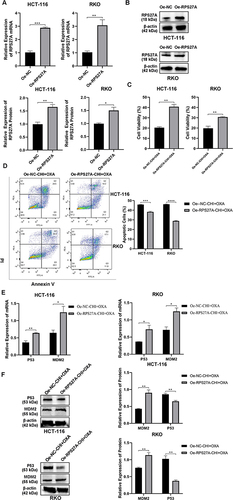
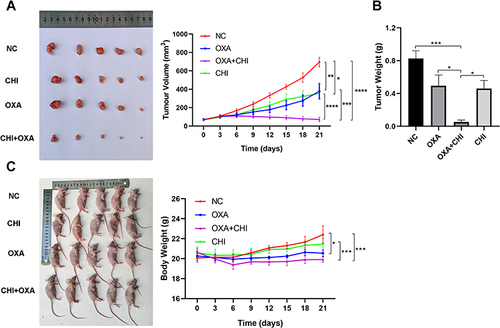
Figure 8 Chidamide and oxaliplatin synergistically inhibited tumor growth in vivo. (A) The influence of chidamide and oxaliplatin monotherapy and the combined treatment had on tumor volume of mice xenograft. (B) The influence of chidamide and oxaliplatin monotherapy and the combined treatment had on tumor weight of mice xenograft. (C) The effects of chidamide and oxaliplatin monotherapy and the combined treatment on mice weight. *P<0.05, **P<0.01, ***P<0.001, ****P<0.0001.