Figures & data
Figure 1 The chemical structures of ligustilide (LIG, a) and n-butylphthalide (NBP, b).
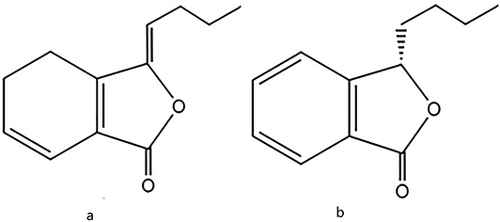
Figure 2 Effects of TMZ, LIG and NBP alone and in combination on survival rate of U251 cells. Each value represents the mean ± SD of six independent experiments. Differs from control group, *p < 0.05, **p< 0.01, ***p< 0.001. Differs from TMZ alone group, ###p< 0.001.
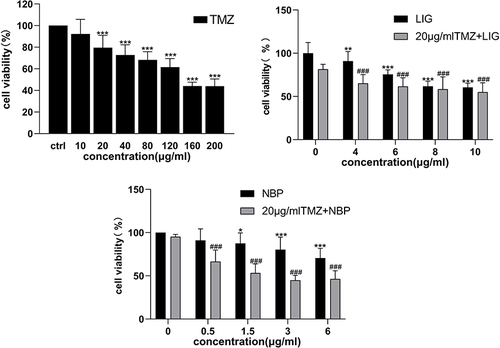
Table 1 Q Values of Survival Rate of U251 Cells in Different Concentration Combined Administration Groups (Mean±SD, n = 6)
Figure 3 Effects of TMZ, LIG and NBP alone or in combination on migration of U251 cells. Values are mean ± standard deviation (n=3). Differs from control group, ***p< 0.001.
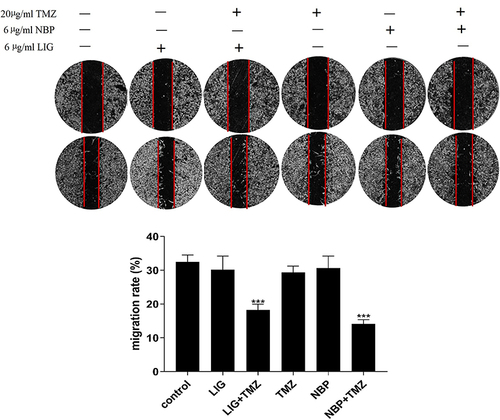
Figure 4 Effects of TMZ, LIG and NBP alone or in combination on invasion of U251 cells (×100). Values are mean ± standard deviation (n=3). Differs from control group, ***p< 0.001.
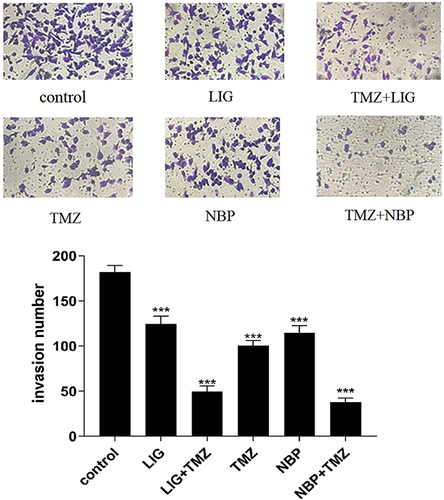
Figure 5 Effects of TMZ, LIG and NBP alone or in combination on apoptosis of U251 cells. Values are mean ± standard deviation (n=3). Differs from control group, **p< 0.01, ***p< 0.001.
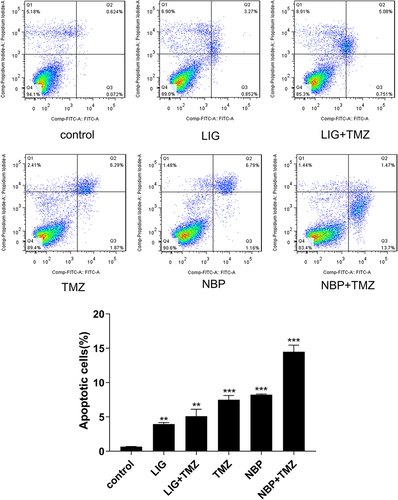
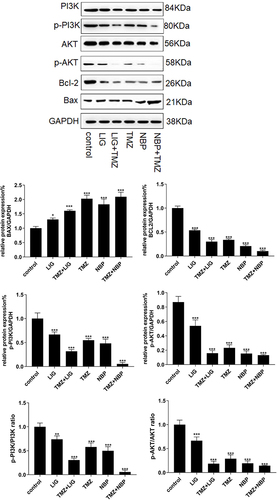
Figure 6 Effects of LIG, NBP and TMZ alone or in combination on the PI3K/Akt signaling pathways in U251 cells. Values are mean ± standard deviation (n=3). Differs from control group, *p < 0.05, **p< 0.01, ***p< 0.001.