Figures & data
Figure 1 PET/CT revealed focal hypermetabolism in the lesions corresponding to the nodules observed in the CT scans before and after the combined treatment. The PET/CT scans conducted in January 5, 2021 (A) and September 23, 2021 (B).
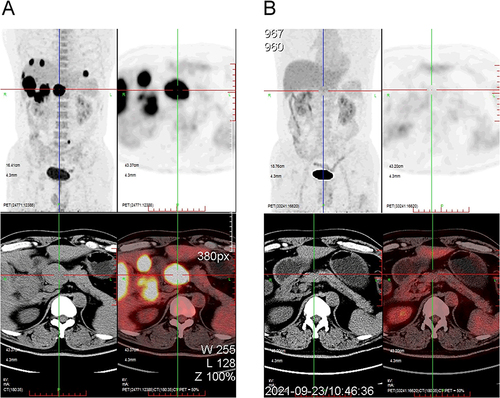
Figure 2 The results of hematoxylin-eosin staining on primary tumors. The liver mass aspiration biopsy revealed partial hepatocytes stasis, red-stained amorphous necrotic foci, and spindle cell hyperplasia fibrous tissue with lymphoid and plasma cell infiltration. The original magnification of the image is 100×. 100×(A) and 200×(B).
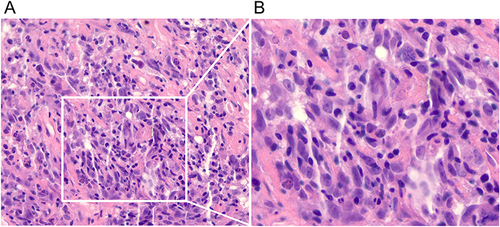
Figure 3 The presents representative immunohistochemical staining images of tissues. The cells exhibited positivity for CD21 (A) and Ki-67 (B). The original magnification of the image is 100×.
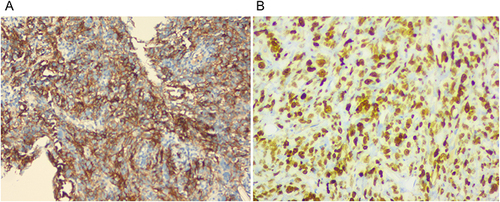
Table 1 The Course of Treatment and Relevant Efficacy
Figure 4 The lesions achieved partial response after 41 cycles of treatment in gallbladder FDCS patient by CT scan.
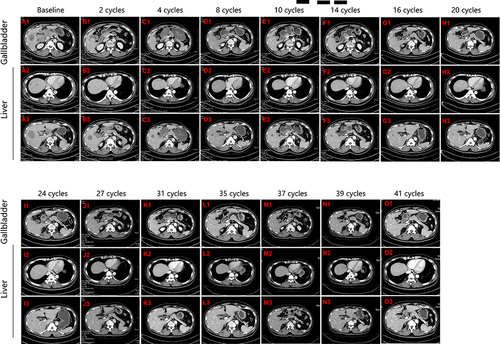
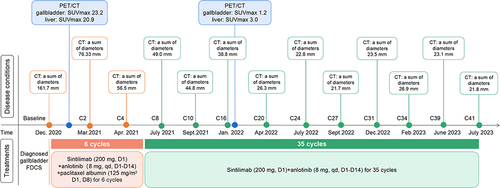
Figure 5 Timeline scheme depicted the major clinical events experienced by the patient since initial diagnosis.