
Figures & data
Table 1 The Pathways and Function of G9a in Various System Tumors
Figure 1 The role and pathways of G9a in various systemic tumors.
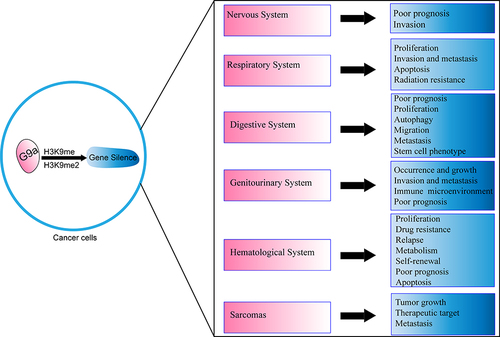
Figure 2 (A) The gene expression profile across all tumor samples and paired normal tissues (Dot plot), each dots represent expression of samples. (B) The gene expression profile across all tumor samples and paired normal tissues (Bar plot), the height of bar represents the median expression of certain tumor type or normal tissue. (C) Disease free survival rate of G9a in tumors. (D) Overall survival rate of G9a in tumors. Tang Z. et al (2017) GEPIA: a web server for cancer and normal gene expression profiling and interactive analyses. Nucleic Acids Res, 10.1093/nar/gkx247.Citation79
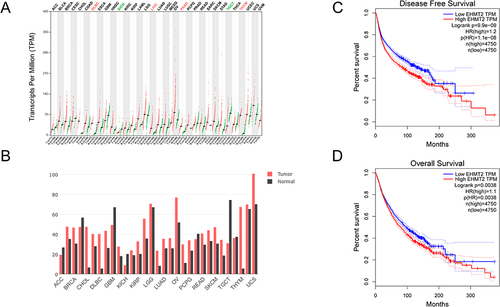
Table 2 The Cancer Type and Function of G9a Inhibitor in Various System Tumors