
Figures & data
Figure 1 This flowchart illustrates the process for selecting patients with pNEC and liver metastasis.
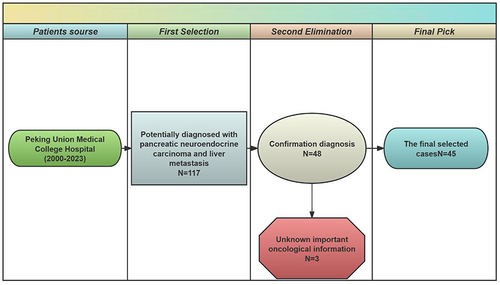
Table 1 Characteristics of 45 Patients with Pancreatic Neuroendocrine Carcinoma Liver Metastasis
Table 2 Univariate Cox Analysis for OS of Patients
Table 3 Multivariate Cox Analysis for OS of Patients
Figure 2 Kaplan-Meier curves demonstrate differences in OS among pNEC patients with liver metastasis concerning: (a) PTR, (b) Tumor size, (c) Chemotherapy or targeted therapy.
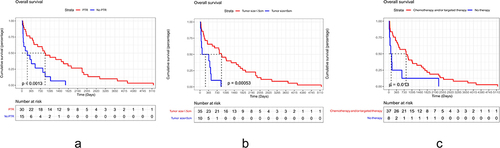
Table 4 The Predictable and Referable Table for Survival
Figure 3 A modified nomogram predictive model for OS is depicted.
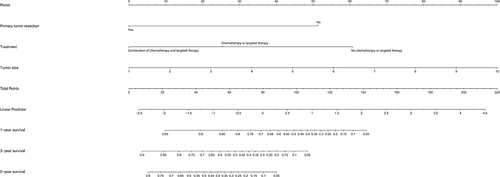
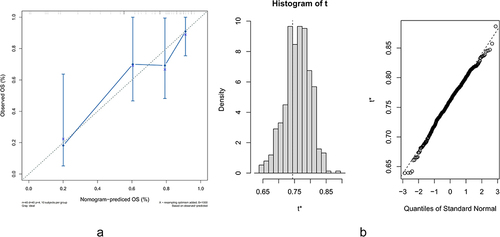
Figure 4 Validation of the prediction model: (a) Calibration plots of nomogram predictions, (b) Bootstrap validation to verify the C-index and its 95% CI for the nomogram regarding OS.
Data Sharing Statement
The datasets used and/or analysed during the current study are available from the corresponding author on reasonable request.