Figures & data
Figure 1 Schematic diagram of the insonation device.
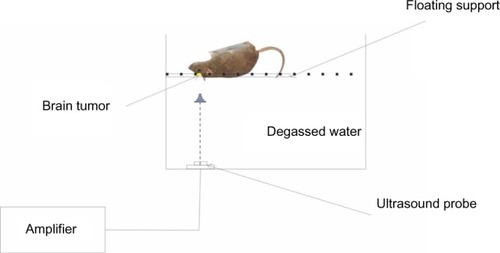
Figure 2 Effect of sonodynamic therapy (SDT) treatment on tumor volume and animal survival time. The tumor volume was measured with conventional light microscopy before treatment and after treatment on Days 3, 7, and 14 (A). Animal survival time was calculated as the number of days until the animal died of natural causes or were anesthetized (B). If a glioma had developed for more than 60 days, survival time was counted as 60 days.
Abbreviations: HMME, hematoporphyrin monomethyl ether; US, ultrasound.
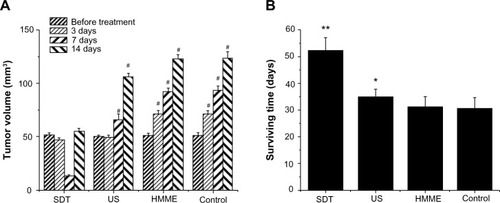
Figure 3 Evaluation of treatments by magnetic resonance imaging (MRI) (A–D), hematoxylin and eosin (HE) staining (E–H), and transmission electron microscopy (TEM) (I–L). Treated by sonodynamic therapy (SDT) (A, E, I), ultrasound (B, F, J), hematoporphyrin monomethyl ether (HMME) (C, G, K), and untreated control (D, H, L).
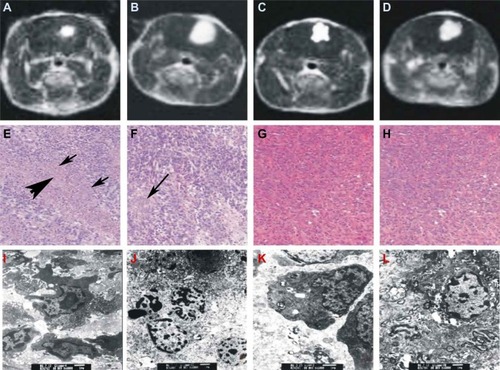
Figure 4 Effect of sonodynamic therapy (SDT) on apoptosis detected by TUNEL assay. The images were taken at 24 hours after treatment with SDT (A), ultrasound (US) (B), and hematoporphyrin monomethyl ether (HMME) (C), or after no treatment (D). Summary of in situ apoptosis assay at different times (24 hours, 3 days, and 7 days) after the indicated treatments (E).
Abbreviation: TUNEL, terminal deoxynucleotidyl transferase dUTP nick end labeling.
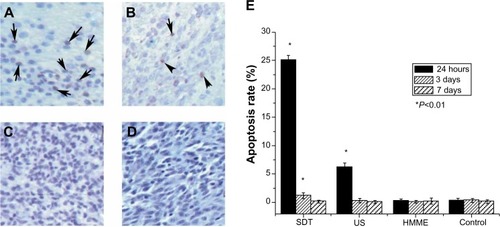
Figure 5 Effect of sonodynamic therapy (SDT) treatment on the expression of protein cytochrome-c (Cyto-C) and protein caspase-3. Immunohistochemical staining with Cyto-C antibody at 24 hours after treatment with SDT (A), ultrasound (US) (B), and hematoporphyrin monomethyl ether (HMME) (C), or after no treatment (D). Summary of the effect of SDT on protein Cyto-C (E). Immunohistochemical staining with caspase-3 antibody at 24 hours after treatment with SDT (G), US (H), and HMME (I), or no treatment (J). Summary of the effect of SDT on protein caspase-3 (F).
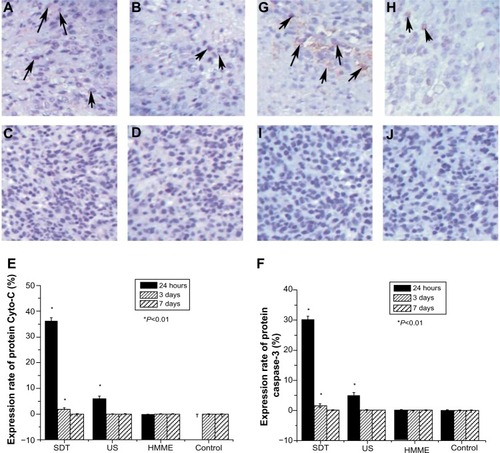
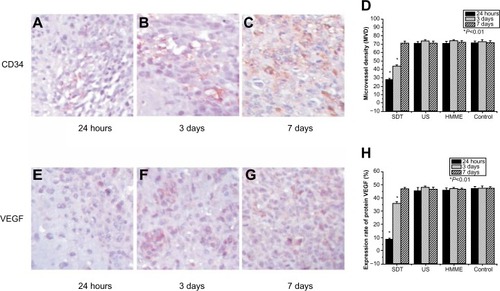
Figure 6 Effect of sonodynamic therapy (SDT) treatment on glioma angiogenesis. Immunohistochemical staining with CD34 antibody at 24 hours (A), 3 days (B), and 7 days (C) after treatment with SDT. Summary of the effect of SDT, US and HMME on microvessel density (MVD) evaluated by counting CD34-positive microvessels (D). Immunohistochemical staining with vascular endothelial growth factor (VEGF) antibody at 24 hours (E), 3 days (F), and 7 days (G) after treatment with SDT. Summary of the effect of SDT, US and HMME on VEGF levels (H).
Abbreviations: US, ultrasound; HMME, hematoporphyrin monomethyl ether.