
Figures & data
Table 1 Clinical features of all patients
Figure 1 Downregulation of SOX9 expression by siRNA interference inhibits HIVEP3 expression in PCa cells.
Abbreviations: PCa, prostate cancer; qRT-PCR, quantitative reverse transcription polymerase chain reaction; siRNA, small interfering RNA; siSOX9, siRNA for SOX9; siNC, normal control siRNA.
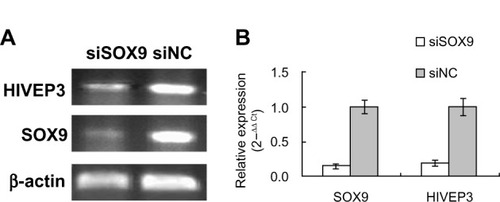
Figure 2 HIVEP3 and SOX9 mRNA expression in PCa and adjacent benign prostate tissues.
Abbreviations: mRNA, messenger RNA; qRT-PCR, quantitative reverse transcription polymerase chain reaction; PCa, prostate cancer.
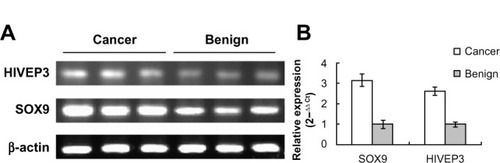
Figure 3 Immunohistochemical staining for HIVEP3 and SOX9 proteins in PCa and adjacent benign prostate tissues.
Abbreviations: PCa, prostate cancer; IRS, immunoreactivity scores.
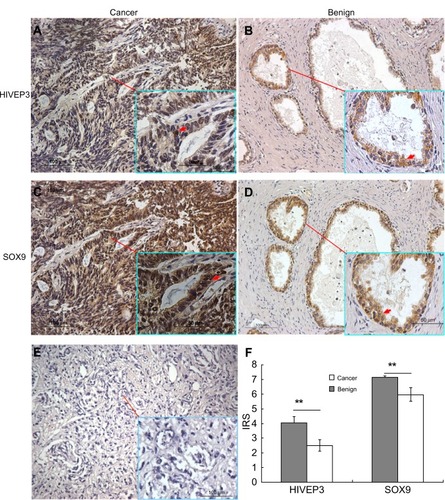
Table 2 Correlation between HIVEP3 and SOX9 expression in prostate cancer samples
Table 3 Association of HIVEP3 and SOX9 protein expression with the conventional clinicopathological characteristics in 98 patients with prostate cancer
Table 4 Association of combined expression of HIVEP3 and SOX9 protein with the conventional clinicopathological characteristics in 98 patients with prostate cancer
Figure 4 Kaplan–Meier survival curves of the biochemical recurrence-free survival and overall survival.
Abbreviation: PCa, prostate cancer.
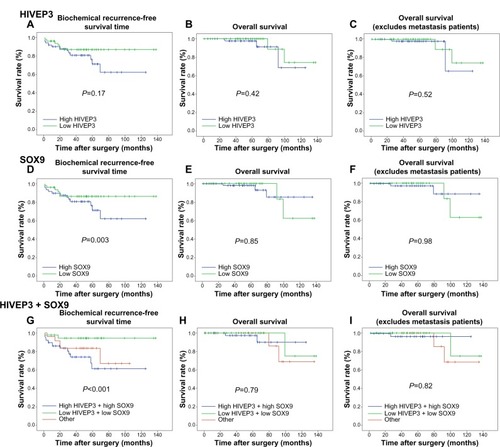
Table 5 Univariate and multivariate analyses of different prognostic factors in 98 patients with prostate cancer