Figures & data
Table 1 Primers for amplification of GRP58, HPRT, and β-actin genes
Table 2 Polymerase chain reaction protocol for GRP58, HPRT, and β-actin
Figure 1 Dose-response curves for HeLa, SiHa, Vero, and 3T3 cells following treatment with cisplatin (i) and thymoquinone (ii) at 24 hours (A), 48 hours (B), and 72 hours (C). The cells (0.7×10⁵ mL−1 for HeLa, 3T3, and Vero cells, and 1×10⁵ mL−1 for SiHa cells) were treated with different concentrations of cisplatin and thymoquinone and subjected to MTT assay.
Abbreviation: MTT, 3-(4,5-Dimethylthiazol-2-yl)-2,5-diphenyltetrazolium bromide.
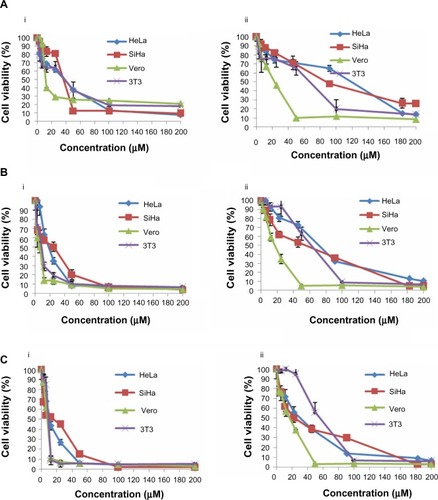
Table 3 Cytotoxicity of cisplatin and thymoquinone towards various human cell lines represented as IC50 value determined by MTT assay
Figure 2 Optimization of quantitative real-time polymerase chain reaction.
Abbreviations: bp, base pairs; RFU, relative fluorescence units.
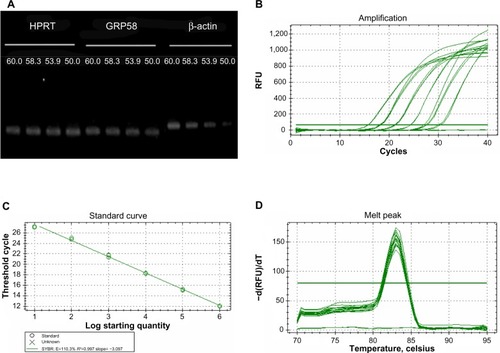
Figure 3 mRNA level of GRP58 in HeLa and SiHa cells following treatment with cisplatin and thymoquinone for 48 hours as measured by quantitative real-time polymerase chain reaction.
Abbreviation: TQ, thymoquinone.
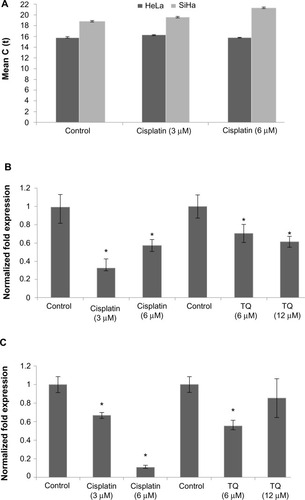
Figure 4 GRP58 expression in human cervical cancer cell lines treated with cisplatin and thymoquinone as determined by Western blot analysis.
Abbreviation: Con, control.
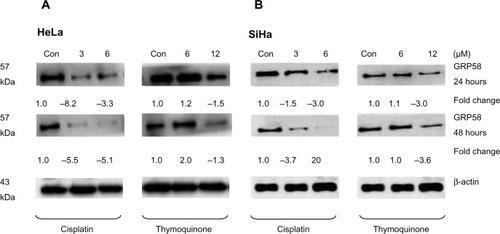
Figure 5 GRP58 levels in HeLa and SiHa cell lines following treatment with cisplatin (A) and thymoquinone (B).
Abbreviations: TQ, thymoquinone; h, hours.
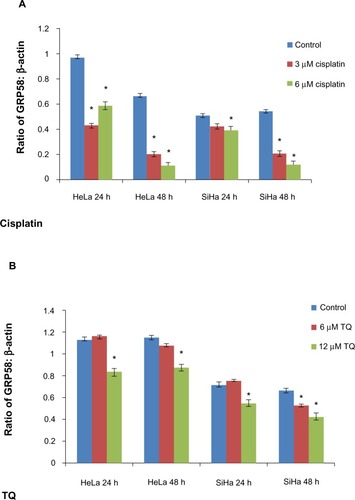
Figure 6 Correlation between density values of the ratio of GRP58 to β-actin and cytotoxicity (IC50 values) in HeLa and SiHa cells following treatment with cisplatin (A) and thymoquinone (B) using Pearson’s correlation method for at least three independent experiments. P<0.05 was considered to be statistically significant.
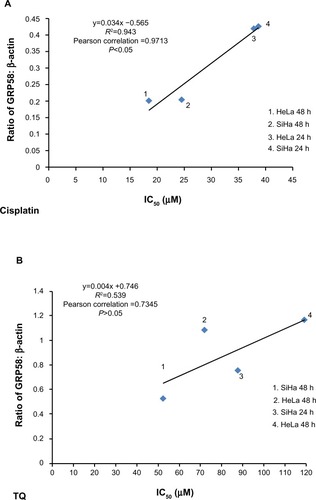
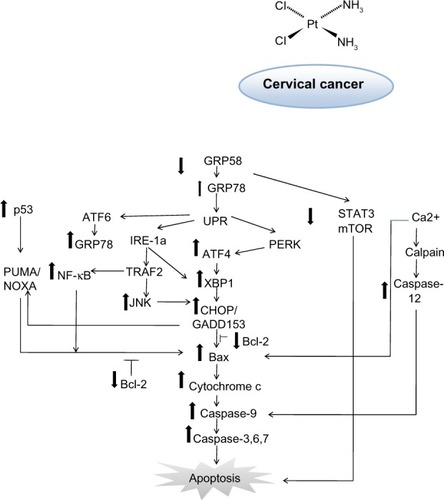
Figure 7 Schematic diagram of proposed mechanism of action for GRP58 in cisplatin-induced apoptosis. The pathways involve the endoplasmic reticulum stress-apoptotic-dependent pathway.