
Figures & data
Table 1 A table summarizing the clinical characteristics of patients from which these new cell lines were derived and established
Figure 1 Photomicrographs showing morphological and immunohistochemical properties of different cell lines.
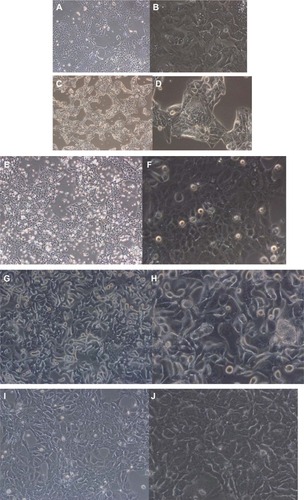
Figure 2 Immunohistochemical staining with TTF1, CK7, and CK20 on paraffin cell blocks for all four lung adenocarcinoma cell lines.
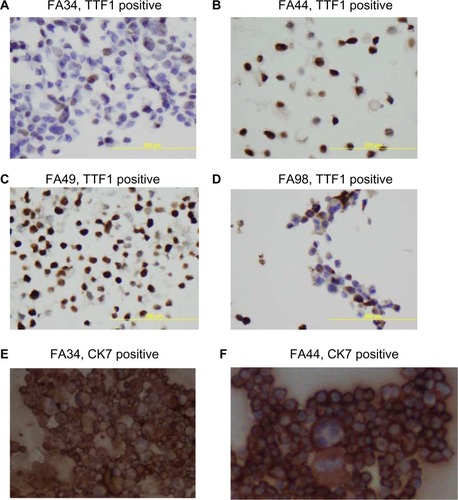
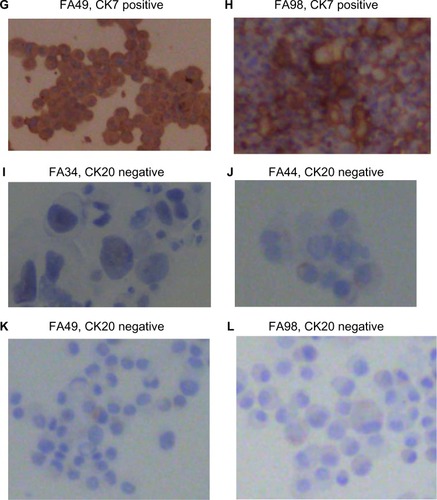
Figure 3 Immunohistochemical staining with Napsin A on paraffin cell blocks for all the four lung adenocarcinoma cell lines.
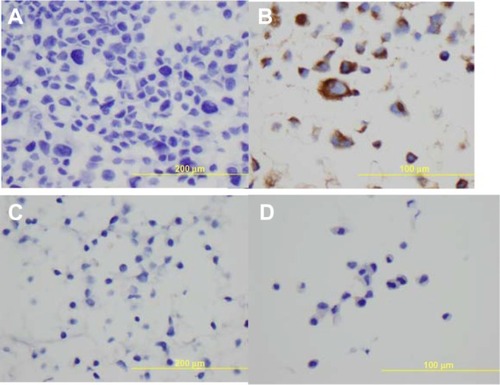
Figure 4 Immunohistochemical staining on paraffin cell blocks from PME1.
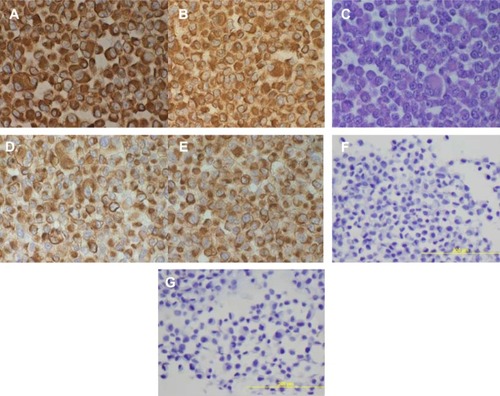
Figure 5 Growth curves of all the cell lines showing the initial lag phase followed by accelerated growth phase in most cell lines with FA44, FA49, and FA98 showing the fastest growth rate compared to FA34 and PME1.
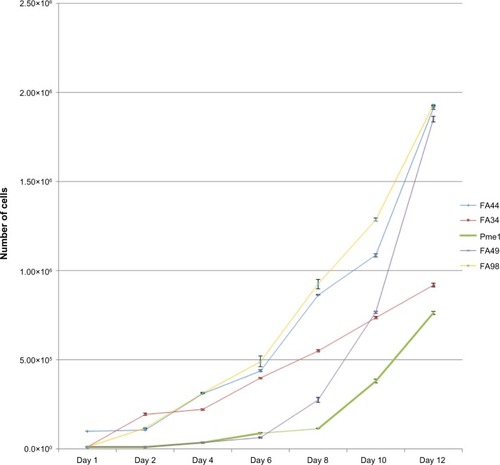
Figure 6 ALK immunohistochemistry and FISH.
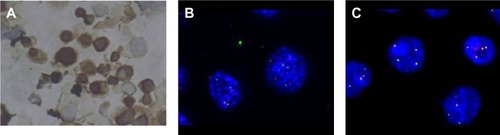
Figure 7 Spectral karyotyping images of all the cell lines.
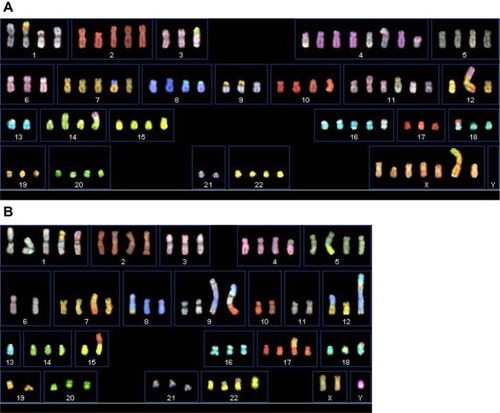
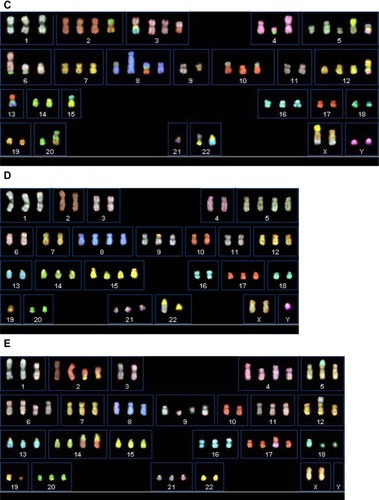
Table 2 Karyotype descriptions in newly established lung cancer cells lines analyzed using spectral karyotyping
Table 3 Summary of mutations of the five cell lines analyzed with targeted sequencing (RainDance OncoSeq)