
Figures & data
Figure 1 Flow diagram summarizing the selection of eligible studies.
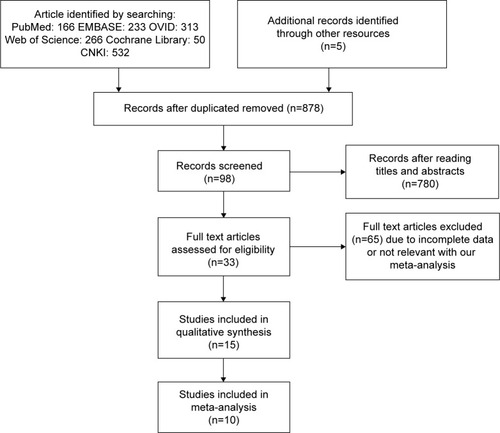
Table 1 Baseline characteristics of studies included in the meta-analysis
Figure 2 Forest plot of MIF –173G/C polymorphism and cancer risk in dominant model.
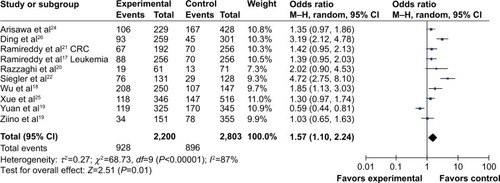
Figure 3 Publication bias in this meta-analysis.
Abbreviation: MIF, migration inhibitory factor.
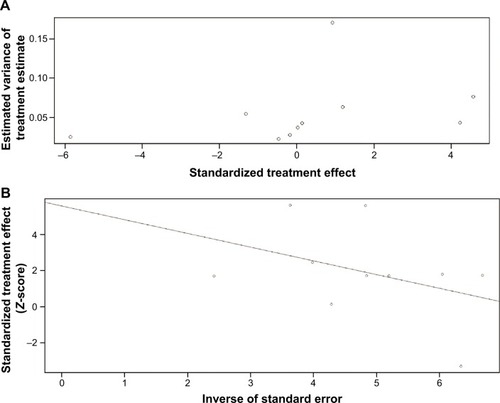
Table 2 A summary of P-values for Begg’s funnel plot and Egger’s test in five genetic models
Figure S1 Preferred reporting items for systematic reviews and meta-analyses (PRISMA) checklist
Notes: Data from Moher D, Liberati A, Tetzlaff J, Altman DG. The PRIS MA Group (2009). Preferred Reporting Items for Systematic Reviews and Meta-Analyses: The PRIS MA Statement. PLoS Med. 6(6):e1000097.1 For more information, visit: www.prisma-statement.org.
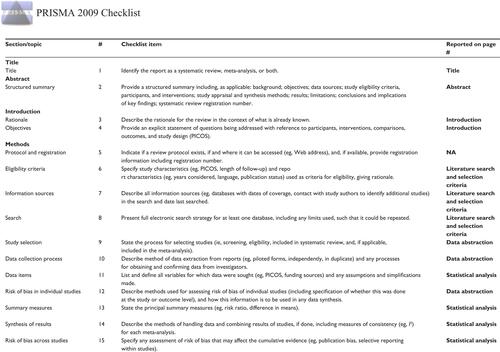
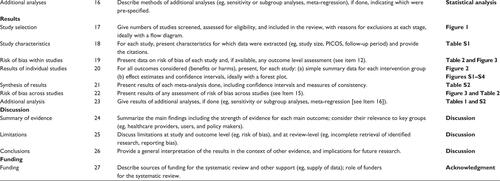
Figure S2 Meta-analysis on genetic association studies checklist
Abbreviations: Para, paragraph; SNP, single nucleotide polymorphisms.
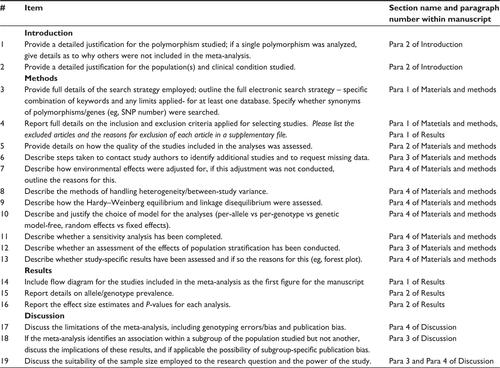
Figure S3 Forest plot of MIF –173G/C polymorphism and cancer risk in heterozygote comparison.
Abbreviations: MIF, migration inhibitory factor; CI, confidence interval.
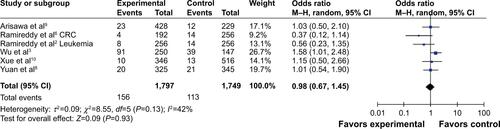
Figure S4 Forest plot of MIF –173G/C polymorphism and cancer risk in recessive model.
Abbreviations: MIF, migration inhibitory factor; CI, confidence interval.
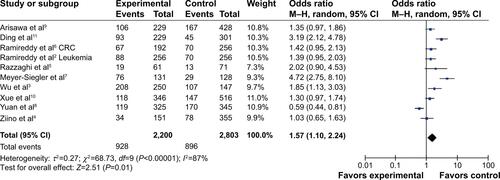
Figure S5 Forest plot of MIF –173G/C polymorphism and cancer risk in homozygote comparison.
Abbreviations: MIF, migration inhibitory factor; CI, confidence interval.
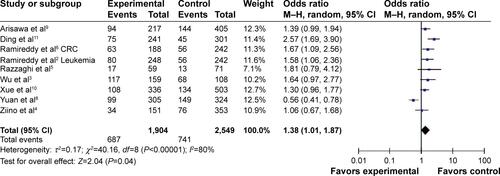
Figure S6 Forest plot of MIF –173G/C polymorphism and cancer risk in allelic model.
Abbreviations: MIF, migration inhibitory factor; CI, confidence interval.
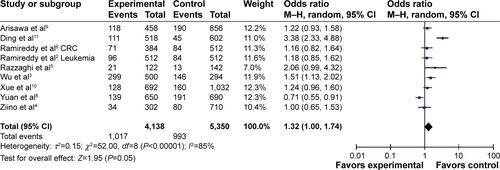
Table S1 A summary of ORs for the overall and subgroup analyses of MIF polymorphism and cancer risk
Table S2 The influence of individual study on ORs in dominant model