Figures & data
Figure 1 The characteristics and cytotoxicity of PS I.
Notes: (A) Molecular structure of PS I. (B) The absorption spectrum; insert: HPLC spectrum. (C) Irradiation dose-dependent and concentration-dependent cytotoxicity. HeLa cells were treated with 15.2 μM of PS I for 24 hours, then irradiated with the indicated dose (ranging from 0 J/cm2 to 36 J/cm2) (-□-, blue line); or cells were treated with the indicated concentration of PS I (ranging from 0 μM to 147 μM) for 24 hours and then irradiated with 18 J/cm2 of red light (-•-, red line). Cell viability was assessed via MTT assay at 24 hours post-PDT. The samples treated with 15.2 μM of PS I without irradiation and irradiation with red light in the absence of PS I served as controls. (D) Post-PDT time-dependent cytotoxicity. Cells were treated with 15.2 μM of PS I for 12 hours, followed by 18 J/cm2 of red light. Cell viability was measured at the indicated times post-PDT. The cells without any treatment served as the control (N). Data represent means ± SDs (n=3). *P<0.05 vs control, **P<0.01 vs control.
Abbreviations: HPLC, high-performance liquid chromatography; MTT, methylthiazolyldiphenyl tetrazolium bromide; PDT, photodynamic therapy; PS I, photosensitizer I; SD, standard deviation.
Abbreviations: HPLC, high-performance liquid chromatography; MTT, methylthiazolyldiphenyl tetrazolium bromide; PDT, photodynamic therapy; PS I, photosensitizer I; SD, standard deviation.
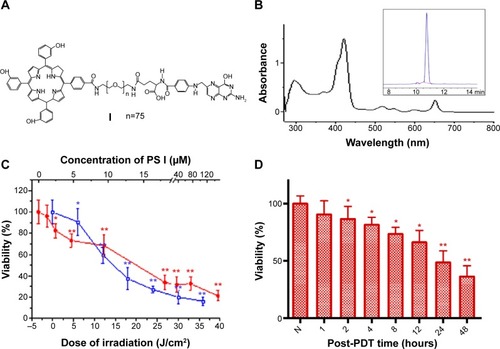
Figure 2 Changes in the cytoskeleton and DNA and apoptotic characteristics of HeLa cells after PDT.
Notes: (A) Changes in F-actin and DNA structures. (B) Results of flow cytometry analysis. N, untreated cells; Ir, only treated with 18 J/cm2 of red light; PS, only incubated in 15.2 μM of PS I for 12 hours; PDT, treated with 15.2 μM of PS I for 12 hours and then irradiated with 18 J/cm2 of red light. The apoptotic cells were measured at 24 hours post-PDT. (C) Post-PDT time dependence. HeLa cells were incubated in 15.2 μM of PS I for 12 hours and then irradiated with 18 J/cm2 of red light. The apoptotic cells were measured via flow cytometry analysis at the indicated times. (D) Irradiation dose dependence and concentration dependence of PDT. HeLa cells were incubated in 15.2 μM of PS I for 12 hours; they were then either irradiated with the indicated dose of red light (red lines) or were incubated in the indicated concentration of PS I for 12 hours and then irradiated with 18 J/cm2 of red light (blue lines). The apoptotic cells were measured at 24 hours post-PDT. Data represent means ± SDs (n=3). *P<0.05 vs control; **P<0.01 vs control.
Abbreviations: FITC, fluorescein isothiocyanate; Ir, irradiation; PDT, photodynamic therapy; PI, propidium iodide; PS I, photosensitizer I; SD, standard deviation.
Abbreviations: FITC, fluorescein isothiocyanate; Ir, irradiation; PDT, photodynamic therapy; PI, propidium iodide; PS I, photosensitizer I; SD, standard deviation.
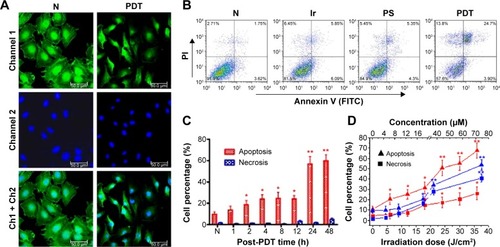
Figure 3 Subcellular localization of PS I.
Notes: HeLa cells were incubated in PS I (15.2 μM, 24 hours) at 37°C and then Mito Tracker Green FM, LysoTracker Yellow HCK-123, and ER-Tracker Blue-White DPX organelle probes were included during the final 0.5 hour. The cells were washed with DPBS prior to CLSM measurement. The first, second, and third rows represent the fluorescence of the organelle probes, PS I, and merge, respectively (left). The fluorescence intensity profiles of PS I (red lines) and the organelle probe (blue and green lines) were examined along the arrows in the confocal images (right). Images are representative of those obtained from three independent experiments. Scale bar, 20 μm.
Abbreviations: CLSM, confocal laser scanning microscopy; DPBS, Dulbecco’s phosphate buffered saline; ER, endoplasmic reticulum; Ly, lysosomes; Mi, mitochondria; PDT, photodynamic therapy; PI, propidium iodide; PS I, photosensitizer I.
Abbreviations: CLSM, confocal laser scanning microscopy; DPBS, Dulbecco’s phosphate buffered saline; ER, endoplasmic reticulum; Ly, lysosomes; Mi, mitochondria; PDT, photodynamic therapy; PI, propidium iodide; PS I, photosensitizer I.
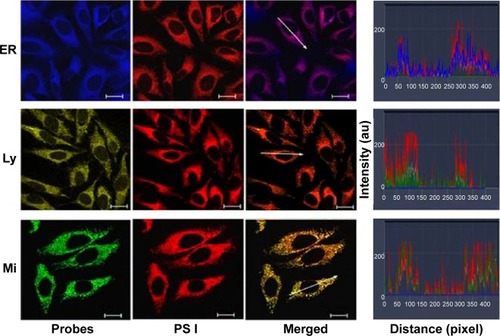
Figure 4 Alterations in intracellular (A) ROS, (B) Ca2+ levels, and (C) MMP and (D) confocal images of HeLa cells stained with R123.
Notes: (A–C) Approximately 30 cells were randomly selected from three independent experiments, and fluorescence intensities were determined by processing the fluorescence images at a single-cell level. Intracellular ROS and Ca2+ levels, as well as the MMP, were measured via continuous confocal scanning. N, untreated cells; Ir, only treated with 18 J/cm2 of red light; PS, only incubated in 15.2 μM of PS I for 12 hours; PDT, incubated in 15.2 μM of PS I for 12 hours and then irradiated with 18 J/cm2 of red light. (D) Confocal images of HeLa cells stained with R123. Cells were incubated in 15.2 μM of PS I for 12 hours and coincubated with R123 for the final half hour; cells were then irradiated with 18 J/cm2 of red light. The fluorescence of R123 was measured (a) soon after PDT or (b) 2 hours post-PDT. Scale bar, 80 μm.
Abbreviations: Ir, irradiation; MMP, mitochondrial membrane potential; PDT, photodynamic therapy; PS I, photosensitizer I; R123, rhodamine 123; ROS, reactive oxygen species.
Abbreviations: Ir, irradiation; MMP, mitochondrial membrane potential; PDT, photodynamic therapy; PS I, photosensitizer I; R123, rhodamine 123; ROS, reactive oxygen species.
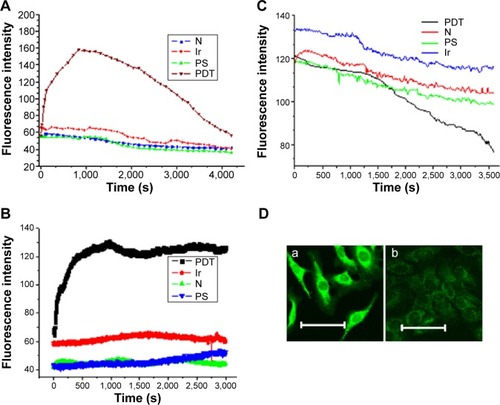
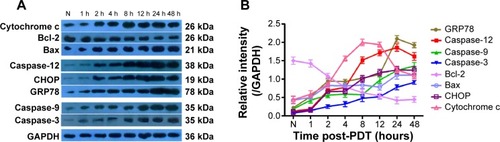
Figure 5 PS I PDT-induced expression of cytochrome c, CHOP, Bax, Bcl-2, caspase-3, caspase-9, caspase-12, and GRP78 in HeLa cells.
Notes: (A) Western blot analysis following PDT. HeLa cells were incubated in 15.2 μM of PS I for 12 hours and then exposed to 18 J/cm2 of red light. Following cell harvesting at 1 hour, 2 hours, 4 hours, 8 hours, 12 hours, 24 hours, and 48 hours after PDT, samples containing equal amounts of protein (100 μg) were loaded into each lane of a sodium dodecyl sulfate–polyacrylamide gel. The protein bands were detected using a Kodak in vivo image analyzer. Protein bands in the grayscale images were quantified using Glyko Bandscan software (Glyko, Novato, CA, USA). GAPDH was used as a loading control. A representative trial of three independent experiments is presented. (B) Quantitative analysis of protein expression according to panel (A). The vertical axis represents the protein expression relative to GAPDH. Data represent means ± SDs (n=3).
Abbreviations: CHOP, C/EBP homologous protein; GAPDH, glyceraldehyde-3-phosphate dehydrogenase; GRP, glucose-regulated protein; PDT, photodynamic therapy; PS I, photosensitizer I.
Abbreviations: CHOP, C/EBP homologous protein; GAPDH, glyceraldehyde-3-phosphate dehydrogenase; GRP, glucose-regulated protein; PDT, photodynamic therapy; PS I, photosensitizer I.