Figures & data
Figure 1 Illustration of nimotuzumab viability influence in H292 and H1975 cells.
Notes: MTT assay revealed that nimotuzumab alone increased H292 viability suppression with time and dose escalation (A and C), but barely influenced H1975 viability (B and D). The suppression ability in H292 cells was still feeble and it was merely 42.5% (calculated separately, not shown in the figure) at maximum dose 1,000 μg/mL.
Abbreviation: MTT, methylthiazolyldiphenyl-tetrazolium bromide.
Abbreviation: MTT, methylthiazolyldiphenyl-tetrazolium bromide.
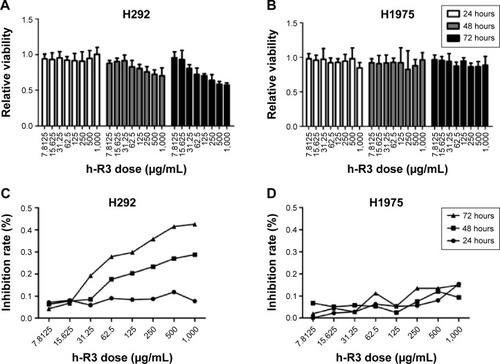
Figure 2 Cell clonogenic survival apoptosis and γ-H2AX formation.
Notes: H292 and H1975 distinct dose-survival curve was illustrated by Figure (A and B) (clonogenic survival assay n=3). Cell apoptosis distribution was shown by (C and D). The total apoptosis percentage was marked at the upper space of the right two quarterns (n=3). There was no statistical significance, but it seemed that H292 cells exhibited the trend of higher apoptotic percentage compared with H1975 cells (P=0.08 and P=0.90 for H292 and H1975 cells, respectively). γ-H2AX formed in both the cytoplasm and the nucleus. Protein formation was more significant in H292 cells (E and G) compared with H1975 cells (F and H). Figure (I) illustrated the brief profile of protein expression (n=3). Each bar represents the mean ± SD and *indicates significant difference (P<0.05).
Abbreviations: h-R3, nimotuzumab group; RT, irradiation group.
Abbreviations: h-R3, nimotuzumab group; RT, irradiation group.
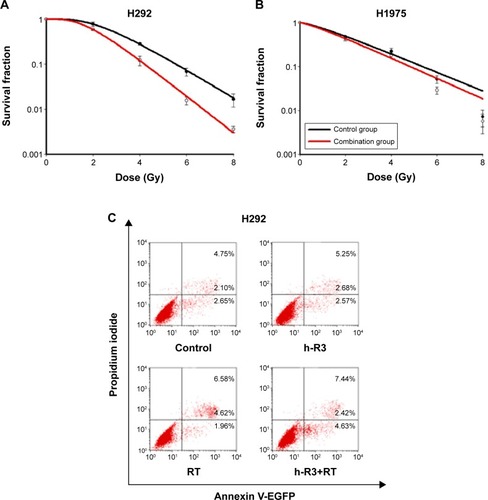
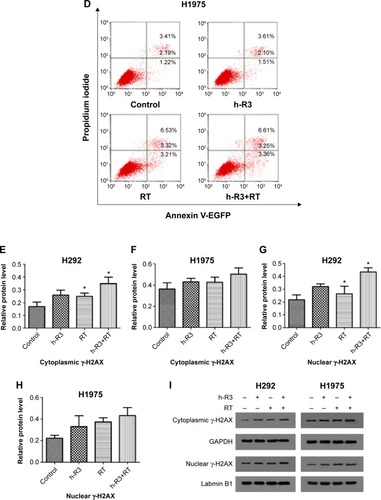
Table 1 Radiation parameters fitted to classic multitarget single-hit model
Table 2 Cell cycle distribution in H292 cells ( ± s)
Table 3 Cell cycle distribution in H1975 cells ( ± s)
Figure 3 Illustration of EGFR/p-EGFR expression in both cytoplasm and nucleus.
Notes: Cytoplasmic p-EGFR expression was decreased in both cell lines when comparing the RT group with the RT+h-R3 group. The decrease was more significant in H292 cells, but the decrease did not reach statistical significance (B and C). Nuclear EGFR and p-EGFR was significantly decreased in H292 cells (D and F, P<0.05), and the decrease in H1975 cells was not statistically significant (E and G). (A) illustrates the brief profile of protein expression (n=3). Each bar represents the mean ± SD and *indicates significant difference (P<0.05).
Abbreviations: EGFR, epidermal growth factor receptor; p-EGFR, phospho-epidermal growth factor receptor; h-R3, nimotuzumab group; RT, irradiation group.
Abbreviations: EGFR, epidermal growth factor receptor; p-EGFR, phospho-epidermal growth factor receptor; h-R3, nimotuzumab group; RT, irradiation group.
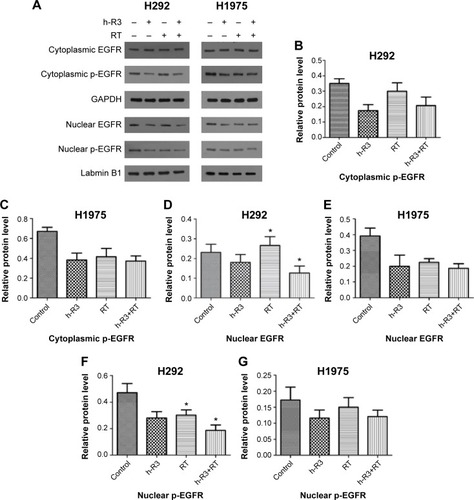
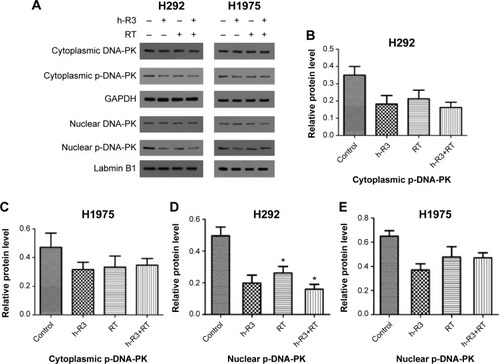
Figure 4 DNA damage repair after irradiation with or without nimotuzumab.
Notes: The p-DNA-PK expression was related to the DNA damage repair activity. Nimotuzumab suppressed H292 cytoplasmic p-DNA-PK expression and scarcely influenced p-DNA-PK expression in H1975 cells (B and C). Nuclear p-DNA-PK in H292 cells was suppressed (P<0.05), while it almost remained the same in H1975 cells (D and E). (A) illustrates the brief profile of protein expression (n=3). Each bar represents the mean ± SD and *indicates significant difference (P<0.05).
Abbreviations: p-DNA-PK, phosphorylated DNA-PK; h-R3, nimotuzumab group; RT, irradiation group.
Abbreviations: p-DNA-PK, phosphorylated DNA-PK; h-R3, nimotuzumab group; RT, irradiation group.