
Figures & data
Table 1 Patients’ characteristics
Figure 1 Changes in TGF-β1 between the RP group and NRP group.
Notes: This image indicates that the cytokine level was 37.77±9.67 pg/mL in RP and 42.13±10.49 pg/mL in NRP before RT. With increasing RT times, the difference between the two groups is readily discernible at the radiation dose of 40 Gy (P=0.00). At the same time, the levels of TGF-β1 were significantly higher than before radiotherapy in the RP group. However, in the NRP group, when compared with before RT, changes in TGF-β1 levels were not statistically significant at each time point of RT (P=0.131; 0.187; 0.317; 0.092). ***Pμ0.01.
Abbreviations: TGF-β1, transforming growth factor-beta-1; RT, radiotherapy; RP, radiation-induced pneumonitis; NRP, non-radiation-induced pneumonitis.
Abbreviations: TGF-β1, transforming growth factor-beta-1; RT, radiotherapy; RP, radiation-induced pneumonitis; NRP, non-radiation-induced pneumonitis.
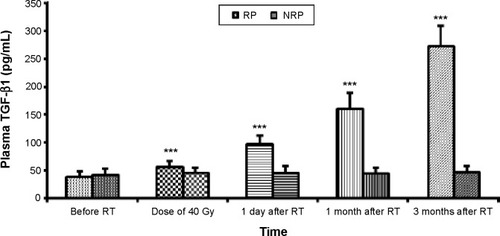
Table 2 Results of repeated measures ANOVA regarding changes in the mean TGF-β1 levels during the course of RT
Figure 2 Changes in IL-1β between the RP group and NRP group.
Abbreviations: IL-1β, interleukin-1 beta; RT, radiotherapy; RP, radiation-induced pneumonitis; NRP, non-radiation-induced pneumonitis.
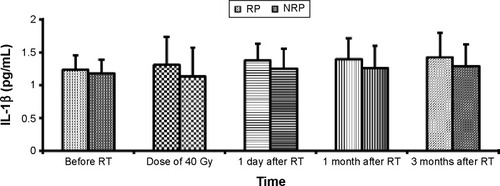
Table 3 Results of repeated measures ANOVA regarding changes in the mean IL-1β levels during the course of RT
Figure 3 Changes in ACE between the RP group and NRP group.
Notes: The ACE levels lowered significantly in the RP group before RT (P=0.00). With the passage of time and RT, the levels of ACE tended to decrease in the RP and NRP groups, but when compared with before RT, the changes in ACE levels were not statistically significant at each time point of RT. ***Pμ0.01.
Abbreviations: ACE, angiotensin-converting enzyme; RT, radiotherapy; RP, radiation-induced pneumonitis; NRP, non-radiation-induced pneumonitis.
Abbreviations: ACE, angiotensin-converting enzyme; RT, radiotherapy; RP, radiation-induced pneumonitis; NRP, non-radiation-induced pneumonitis.
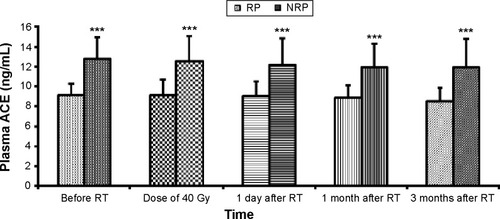
Table 4 Results of repeated measures ANOVA regarding the changes in the mean ACE levels during the course of RT