
Figures & data
Figure 1 Fascin-1 expression in NSCLC tissues (SP ×100).
Notes: (A) Nucleus staining of squamous cell carcinoma; (B) cytoplasm staining of squamous cell carcinoma; (C) nucleus staining of adenocarcinoma; (D) cytoplasm staining of adenocarcinoma.
Abbreviation: NSCLC, non-small cell lung cancer.
Abbreviation: NSCLC, non-small cell lung cancer.
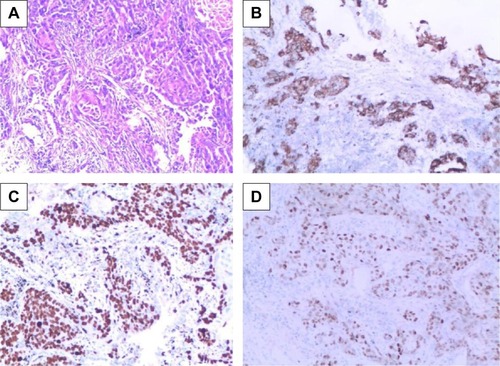
Figure 2 Fascin-1 mRNA was detected by RT-PCR.
Abbreviations: NSCLC, non-small cell lung cancer; RT-PCR, real-time polymerase chain reaction.
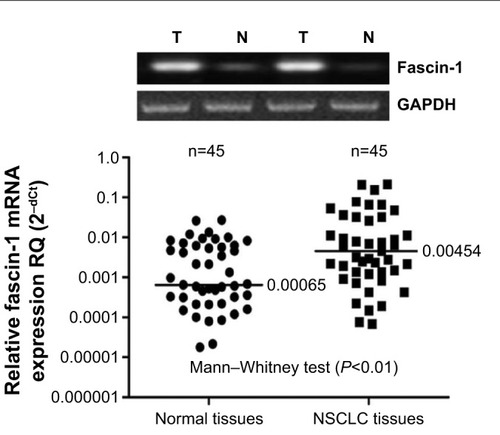
Figure 3 Fascin-1 protein was detected by western blot analysis.
Abbreviation: NSCLC, non-small cell lung cancer.
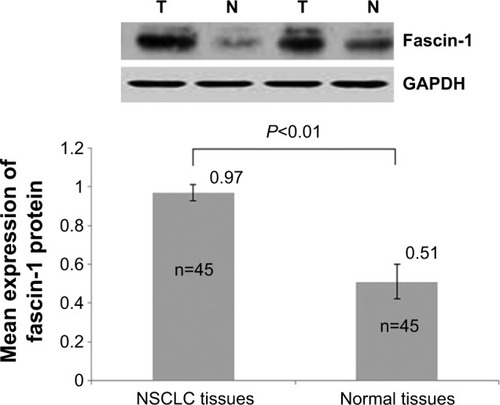
Table 1 Correlation of clinicopathologic variables with fascin-1 protein in NSCLC
Figure 4 Kaplan–Meier curves of DFS and OS.
Notes: (A) DFS of all patients with NSCLC, (B) OS of all patients with NSCLC, (C) OS according to lymph node metastasis in patients with NSCLC, and (D) OS according to stage in patients with NSCLC.
Abbreviations: DFS, disease-free survival; OS, overall survival.
Abbreviations: DFS, disease-free survival; OS, overall survival.
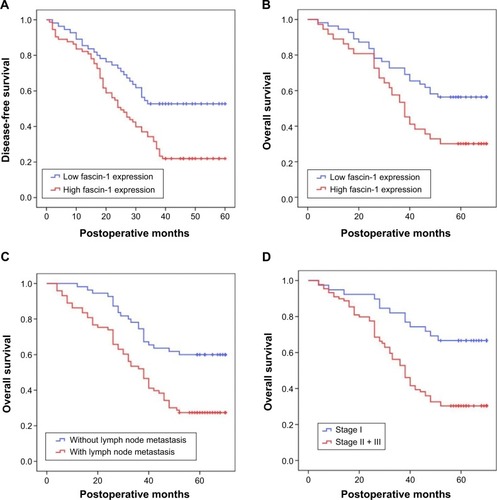
Table 2 DFS and OS of NSCLC patients according to fascin-1 expression
Table 3 Univariate and multivariate analysis for overall survival