Figures & data
Figure 1 Pathological findings of the pulmonary metastases from malignant uterine PEComa.
Notes: (A) Hematoxylin and eosin stain, magnification ×100. (B and C) HMB-45 and SMA immunohistochemical stain, magnification ×200. (D) Ki-67 immunohistochemical stain, magnification ×200. The average Ki-67 labeling index is 40% in this tumor. Background staining was identified by negative controls in which the sections were performed by substitution of primary antibodies with phosphate buffer solution.
Abbreviations: HMB-45, human melanoma black 45; PEComa, perivascular epithelioid cell tumor; SMA, smooth muscle actin.
Abbreviations: HMB-45, human melanoma black 45; PEComa, perivascular epithelioid cell tumor; SMA, smooth muscle actin.
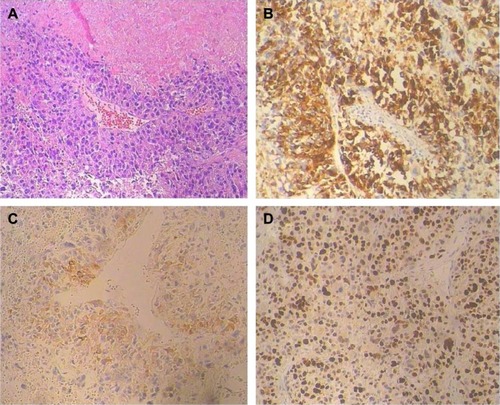
Figure 2 The 18F-FDG PET/CT scans of the patient.
Notes: (A and B) Axial CT image in the lung window and axial PET/CT fusion image at the level of inferior pulmonary vein. Circles: pulmonary metastases. (C and D) Axial CT image in the abdominal window and axial PET/CT fusion image at the level above hepatic portal. Arrows: liver metastases. (E and F) Axial CT image in the abdominal window and axial PET/CT fusion image at the level of hepatic portal. Boxes: metastatic foci growing from previous left kidney bed. (G) Maximum intensity projection image 18F-FDG PE T showed tumor emboli in bilateral upper pulmonary artery (arrowheads), left atrium (short arrow), and inferior vena cava (long arrow).
Abbreviations: CT, computed tomography; FDG, fluorodeoxyglucose; PET, positron emission tomography.
Abbreviations: CT, computed tomography; FDG, fluorodeoxyglucose; PET, positron emission tomography.
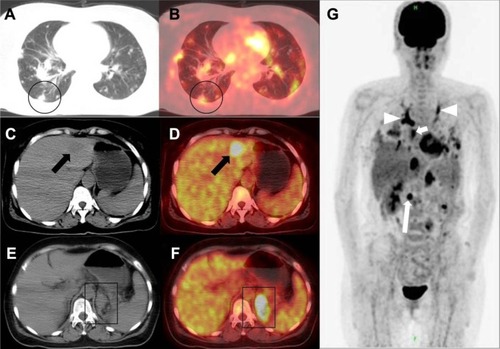
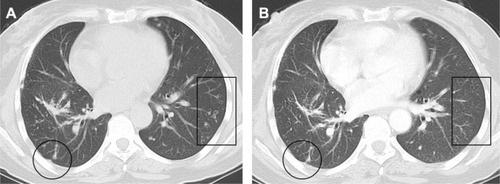
Figure 3 Follow-up CT scans of the patient.
Notes: (A) Partial response was observed by CT at 3 month after the initiation of the mTOR inhibitor treatment. For example, the size of the largest lesion in lung was reduced from 9 to 4 mm (circle). Some other pulmonary metastases were cavitated (box). (B) Nearly complete response was observed by CT at 7 months after the initiation of the mTOR inhibitor treatment. Fibrosis was observed at the largest pulmonary metastatic focus (circle). No other residual lesion was discernible (box).
Abbreviations: CT, computed tomography; mTOR, mammalian target of rapamycin.
Abbreviations: CT, computed tomography; mTOR, mammalian target of rapamycin.