
Figures & data
Figure 1 Heatmap of differentially expressed genes (DEGs) between samples of human epithelial ovarian cancer cell line TOV112D untreated and treated with NSC319726.
Notes: Red: upregulated DEGs; green: downregulated DEGs. Untreated 1–3: three identical samples of TOV112D cells untreated with NSC319726. Treated 1–3: three identical samples of TOV112D cells treated with NSC319726.
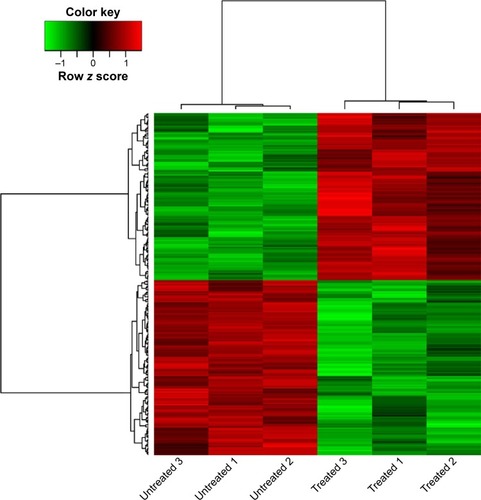
Table 1 KEGG pathways impacted by differentially expressed genes (DEGs) in samples of human epithelial ovarian cancer cell line TOV112D treated with NSC319726
Table 2 The results of functional annotation of differentially expressed genes
Figure 2 The constructed protein–protein interaction network of differentially expressed genes (DEGs).
Notes: Pink: upregulated DEGs; green: downregulated DEGs.
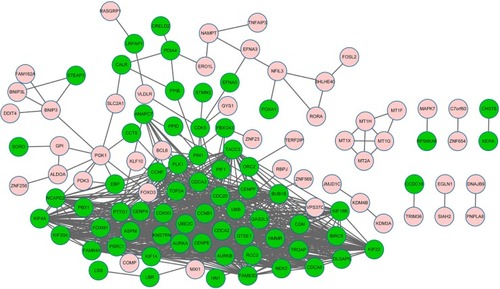
Figure 3 The constructed subnetwork of differentially expressed genes (DEGs).
Notes: Pink: upregulated DEGs; green: downregulated DEGs.
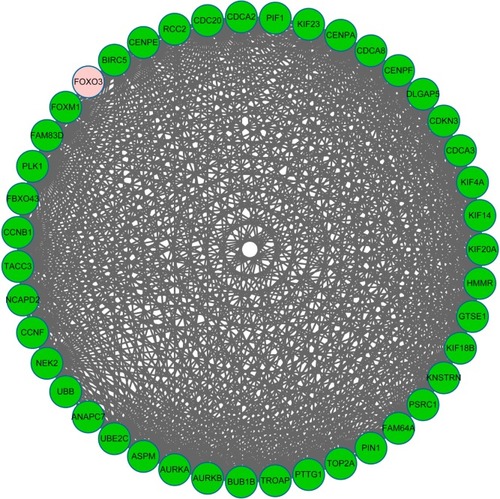
Table 3 Gene Ontology (GO) functional enrichment analysis of differentially expressed genes (DEGs) in the subnetwork (top 4)