
Figures & data
Figure 1 18F-FET PET-guided stereotactic serial biopsy of a frontal lesion.
Abbreviations: FET, fluoroethyl tyrosine; PET, positron-emission tomography; MRI, magnetic resonance imaging; UR, uptake ratio.
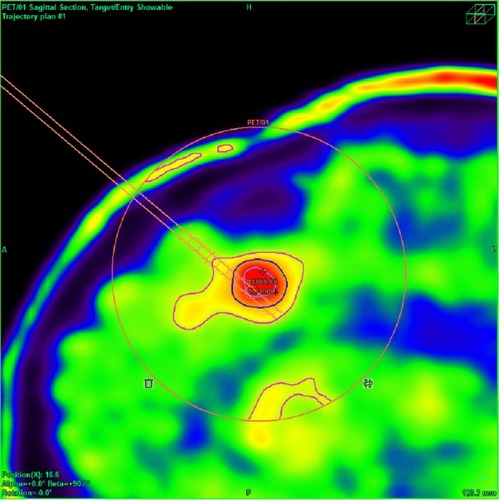
Figure 2 Automated hot-spot detection on surgical planning of 18FET PET-guided stereotactic serial biopsy.
Abbreviations: FET, fluoroethyl tyrosine; PET, positron-emission tomography; CT, computed tomography; MRI, magnetic resonance imaging.
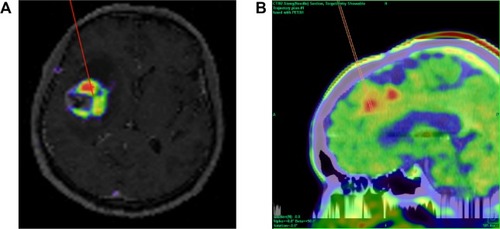
Figure 3 Box-and-whisker plots displaying distribution and quartiles.
Abbreviations: UR, uptake ratio; LGG, low-grade glioma; HGG, high-grade glioma; SD, standard deviation; WHO, World Health Organization.
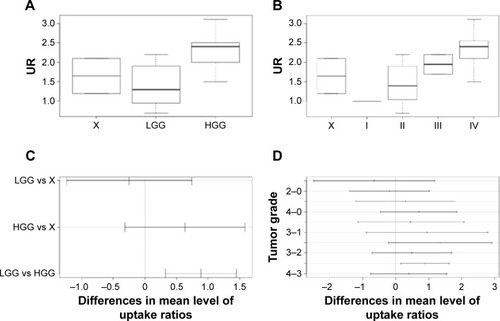
Figure 4 18F-FET PET-guided stereotactic serial biopsy of a left frontal lesion.
Abbreviations: FET, fluoroethyl tyrosine; PET, positron-emission tomography; CT, computer tomography.
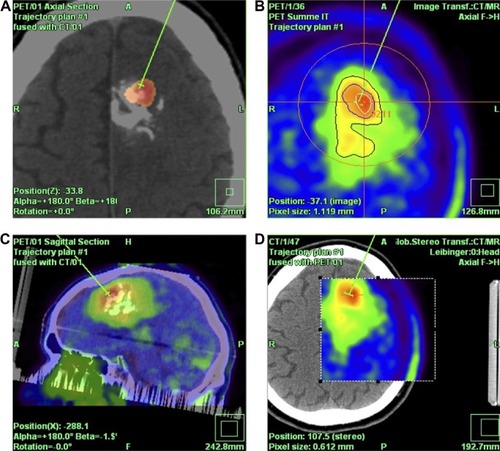
Figure 5 FET PET-guided stereotactic biopsy.
Abbreviations: FET, fluoroethyl tyrosine; PET, positron-emission tomography; UR, uptake ratio; R, right; L, left.
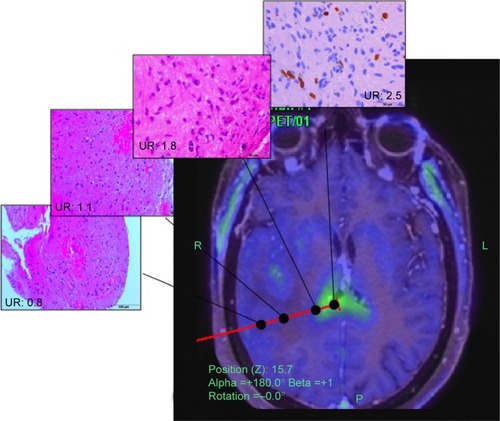
Figure 6 18F-FET PET-guided stereotactic serial biopsy of an insular lesion.
Abbreviations: FET, fluoroethyl tyrosine; PET, positron-emission tomography; UR, uptake ratio.
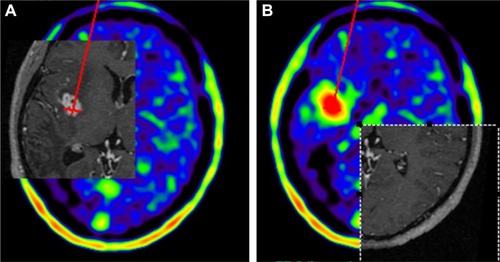
Figure 7 18F-FET PET-guided stereotactic serial biopsy of a frontal lesion.
Abbreviations: FET, fluoroethyl tyrosine; PET, positron-emission tomography; MRI, magnetic resonance imaging.
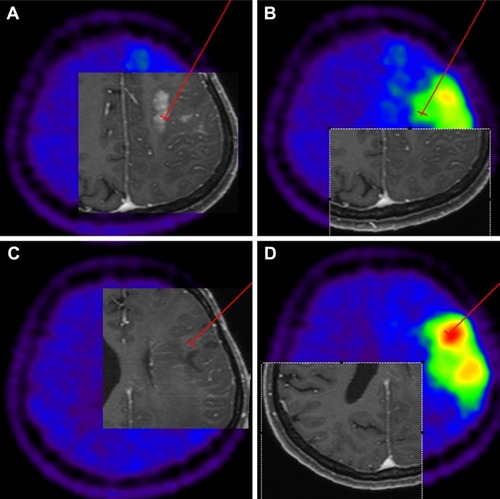
Table 1 Correlation matrix between histopathological findings and FET uptake values
Table 2 The first one-way analysis of variance testCitation23 was used to evaluate differences in cortical uptake rate among three different grades of brain lesions (low-grade glioma, high-grade glioma, and no grade)
Table 3 Tukey’s honest significant difference comparisons for analysis of variance 1
Table 4 The second one-way analysis of variance testCitation23 was used to evaluate differences in cortical uptake rate among five different grades of brain lesions (WHO-I, -II, -III, -IV, and no-grade group)
Table 5 Tukey’s honest significant difference comparisons for analysis of variance 2
Table S1 Histopathological findings, classified and clustered
Table S2 Analysis of variance (descriptive per group)