Figures & data
Figure 1 MR images of control and tumor group rats.
Notes: Small-animal MR images of control group rats (A) and tumor group rats with induced pituitary tumor at 4 weeks (B) and tumor at 6 weeks (C) and tumor group rats with pituitary apoplexy at 8 weeks (D). Red solid arrows indicate normal pituitary or prolactinoma.
Abbreviations: trans, transverse view; sag, sagittal view; cor, coronal view; MR, magnetic resonance.
Abbreviations: trans, transverse view; sag, sagittal view; cor, coronal view; MR, magnetic resonance.
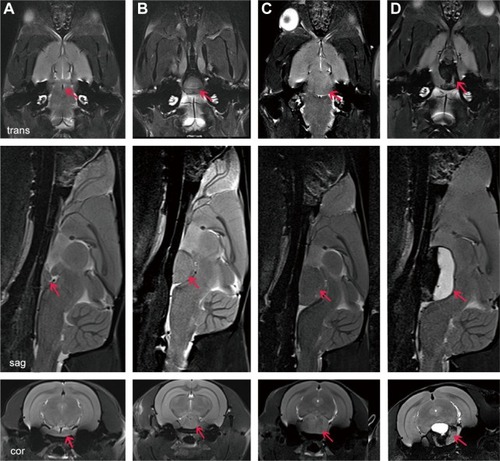
Figure 2 Enhanced MR images and photos of control and tumor group rats.
Notes: Small-animal MR images of normal pituitary (A) and induced pituitary tumor at 4 weeks (B) and 6 weeks (C), and T2-weighted image (T2) and contrast-enhanced T1-weighted image (T1-E). Red solid arrows indicate normal pituitary or prolactinoma.
Abbreviations: MR, magnetic resonance; PHO, photo view.
Abbreviations: MR, magnetic resonance; PHO, photo view.
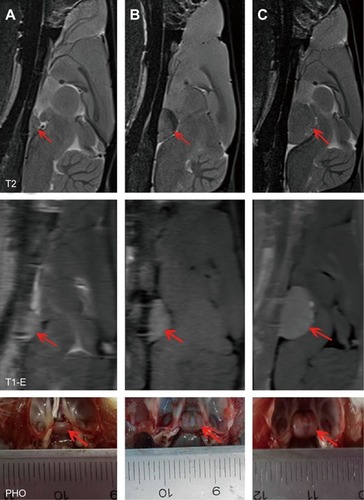
Figure 3 PET images with 18F-fallypride of control and tumor group rats.
Notes:
18F-fallypride small-animal PET images of a control group rat (A) and tumor group rat with induced pituitary tumor at 4 (B) and 6 weeks (C). Solid arrows indicate normal pituitary or prolactinoma.
Abbreviation: PET, positron emission tomography.
Abbreviation: PET, positron emission tomography.
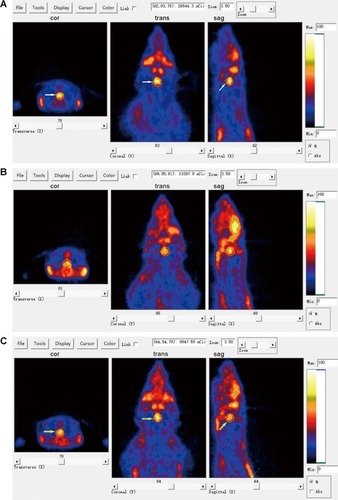
Figure 4 PET images with 18F-FDG of control and tumor group rats.
Notes:
18F-FDG small-animal PET images of control group rats (A) and tumor group rats with an induced pituitary tumor at 4 (B) and 6 weeks (C). Solid arrows indicate normal pituitary or prolactinoma.
Abbreviations: PET, positron emission tomography; 18F-FDG, 18F-fluorodeoxyglucose.
Abbreviations: PET, positron emission tomography; 18F-FDG, 18F-fluorodeoxyglucose.
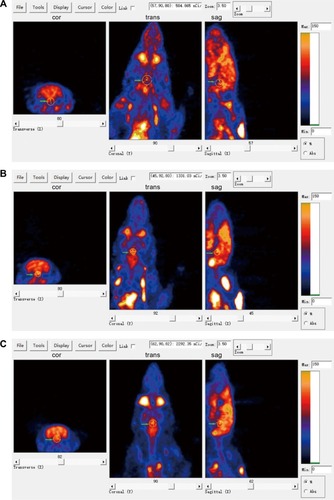
Figure 5 The statistics of differences between the control and tumor groups.
Notes: (A) Weight of the rat in the control and tumor groups; (B) the volume of the rat pituitary in the control and tumor groups; (C) weight of the rat pituitary in the control and tumor groups; (D) the serum PRL levels in the control and tumor groups; (E) relative mRNA expression of DRD2 in the control group, 4-week prolactinomas, and 6-week prolactinomas; (F) the biodistribution of 18F-fallypride and 18F-FDG in the pituitary, and the %ID/g of the control and tumor groups. (G and H) Relative expression of DRD2 protein relative to GAPDH based on Western blotting in the control group, 4-week prolactinomas, and 6-week prolactinomas. *P<0.05 or **P<0.01 was statistically significant.
Abbreviations: mRNA, messenger RNA; DRD2, dopamine receptor-D2; GAPDH, Glyceraldehyde-3-Phosphate Dehydrogenase; PRL, prolactin; %ID/g, percentage of injected radioactivity dose per gram of tissue; W, week; 18F-FDG, 18F-fluorodeoxyglucose.
Abbreviations: mRNA, messenger RNA; DRD2, dopamine receptor-D2; GAPDH, Glyceraldehyde-3-Phosphate Dehydrogenase; PRL, prolactin; %ID/g, percentage of injected radioactivity dose per gram of tissue; W, week; 18F-FDG, 18F-fluorodeoxyglucose.
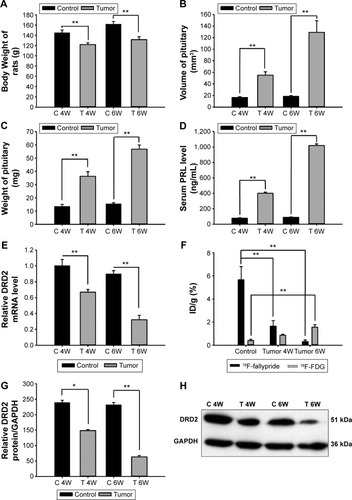
Figure 6 The results of molecular biology experiments between control and tumor groups.
Notes: (A) HE immunohistochemical staining of the control group rats with normal pituitary and tumor group rats with an induced prolactinoma at 4 weeks and 6 weeks. (B) Reticular fiber staining of the control group rats with normal pituitary and tumor group rats with an induced prolactinoma at 4 and 6 weeks. (C) VEGF IHC staining of the control group rats with normal pituitary and tumor group rats with an induced prolactinoma at 4 and 6 weeks. Scale bar, 50 μm.
Abbreviations: IHC, immunohistochemistry; HE, hematoxylin and eosin; VEGF, vascular endothelial growth factor; W, week.
Abbreviations: IHC, immunohistochemistry; HE, hematoxylin and eosin; VEGF, vascular endothelial growth factor; W, week.
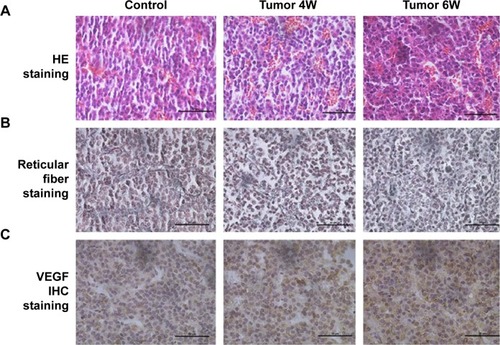
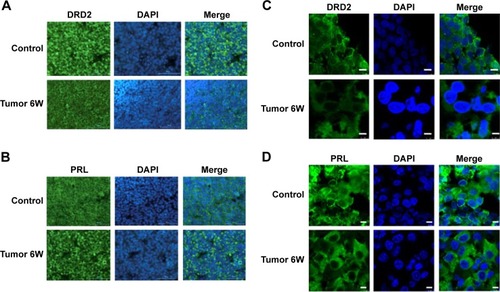
Figure 7 Expression of DRD2 (A, C) and PRL (B, D) in the control and 6 weeks tumor groups.
Notes: Immunofluorescence staining for DRD2 (green) and PRL (green) and the nucleus (DAPI, blue) were performed; the results show the significant downregulation of DRD2 and upregulation of PRL in the 6 weeks tumor group. (A, B): scale bar, 50 μm; (C, D): scale bar, 5 μm.
Abbreviations: DRD2, dopamine receptor-D2; PRL, prolactin; DAPI, 4′,6-diamidino-2-phenylindole; W, week.
Abbreviations: DRD2, dopamine receptor-D2; PRL, prolactin; DAPI, 4′,6-diamidino-2-phenylindole; W, week.