Figures & data
Table 1 Newcastle–Ottawa quality assessment scale for cohort studies
Figure 1 Flow diagram of the study selection process.
Abbreviations: OPN, osteopontin; NSCLC, non-small-cell lung cancer.
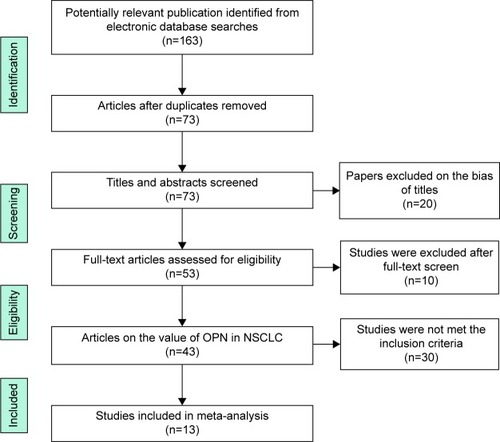
Table 2 Characteristics of studies included in the meta-analysis
Figure 2 Meta-analysis of the association between OPN overexpression and OS of NSCLC.
Notes: The summary HR and 95% CIs were also shown (according to the random-effect estimations). Weights are from random-effects analysis.
Abbreviations: OPN, osteopontin; OS, overall survival; NSCLC, non-small-cell lung cancer; HR, hazard ratio; CI, confidence interval.
Abbreviations: OPN, osteopontin; OS, overall survival; NSCLC, non-small-cell lung cancer; HR, hazard ratio; CI, confidence interval.
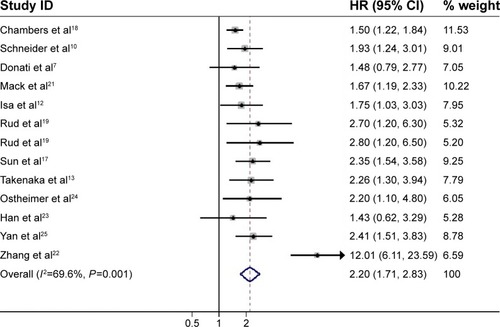
Table 3 Subgroup analysis of the OPN levels in NSCLC patients
Figure 3 Meta-analysis of the association between OPN overexpression and DFS of NSCLC.
Notes: The summary HR and 95% CIs were also shown (according to the random-effect estimations). Weights are from random-effects analysis.
Abbreviations: OPN, osteopontin; NSCLC, non-small-cell lung cancer; DFS, disease-free survival; HR, hazard ratio; CI, confidence interval.
Abbreviations: OPN, osteopontin; NSCLC, non-small-cell lung cancer; DFS, disease-free survival; HR, hazard ratio; CI, confidence interval.
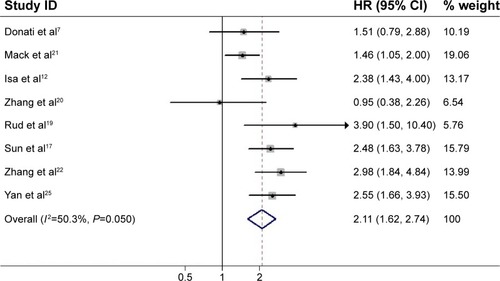
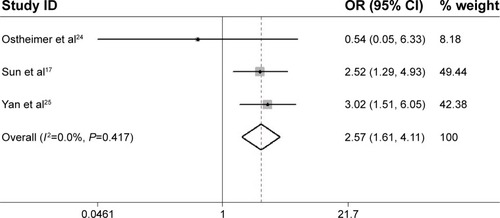
Figure 4 Meta-analysis of the association between OPN overexpression and tumor TNM stage of NSCLC.
Note: The summary OR and 95% CIs were also shown (according to the fixed-effect estimations).
Abbreviations: OPN, osteopontin; NSCLC, non-small-cell lung cancer; OR, odds ratio; CI, confidence interval.
Abbreviations: OPN, osteopontin; NSCLC, non-small-cell lung cancer; OR, odds ratio; CI, confidence interval.