
Figures & data
Table 1 Summary of mRNA expression profiles for gastric cancer
Table 2 Top ten differentially expressed genes
Table 3 Top ten differentially expressed miRNAs
Figure 1 The numbers of target genes for DEmiRs.
Abbreviation: DEmiR, differentially expressed miRNA.
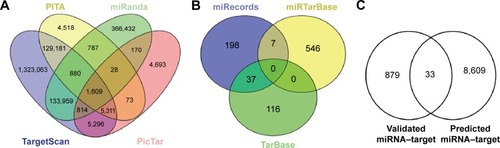
Figure 2 The number of risk genes.
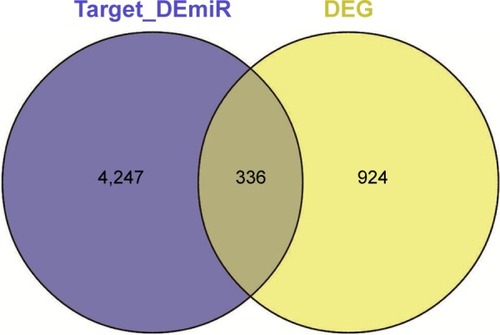
Figure 3 Enriched functions and pathways of risk genes.
Abbreviation: ECM, extracellular matrix.
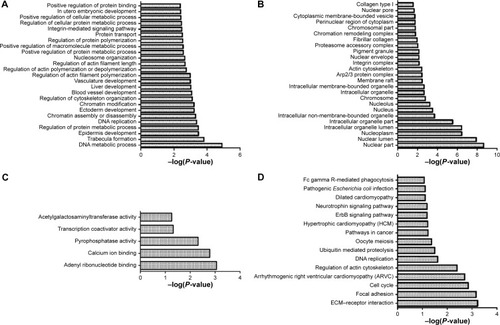
Figure 4 Heat map of the pathway expression profile.
Abbreviations: GABA, gamma-aminobutyric acid; TGF-β, transforming growth factor-β; VEGF, vascular endothelial growth factor; cAMP, 3′,5′-cyclic adenosine monophosphate; TNF, tumor necrosis factors; GnRH, gonadotropin-releasing hormone; TRP channels, transient receptor potential channels; AMPK, AMP-activated protein kinase; NOD, nucleotide-binding, oligomerization domain; RIG-I, retinoic acid-inducible gene 1; NF-κB, nuclear factor kappa-light-chain-enhancer of activated B cells; ECM, extracellular matrix; PI3K, phosphatidylinositol 3-kinase; ABC transporters, ATP-binding cassette transporters; HTLV-I, human T-cell lymphotropic virus type 1; cGMP, 3′,5′-cyclic guanosine monophosphate; PPAR, peroxisome proliferator-activated receptors; Jak-STAT, janus kinase-signal transducer and activator of transcription; MAPK: mitogen-activated protein kinase; mTOR, mammalian target of rapamycin.
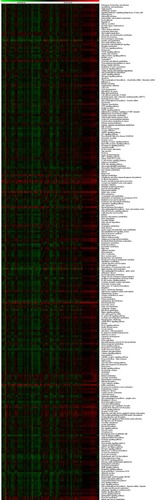
Figure 5 miRNA-risk gene-pathway pair complex network.
Abbreviation: ECM, extracellular matrix.
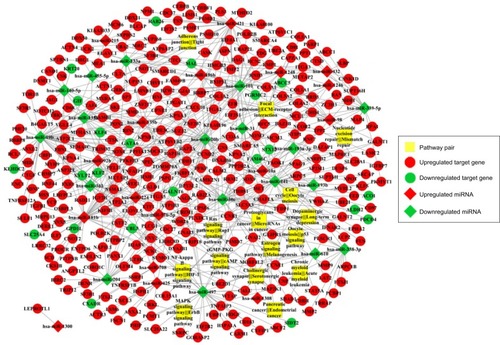
Figure 6 Interactive nodes of risk gene CALM2 in the integrated network of miRNA–risk gene–pathway pair.
Abbreviation: ECM, extracellular matrix.
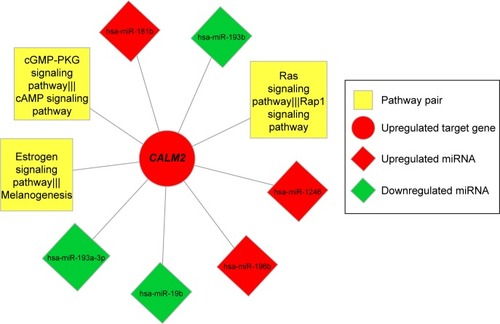
Figure 7 Expressions and classification efficacy of two miRNAs with highest degrees in the integrated network.
Abbreviation: ROC, receiver operating characteristic.
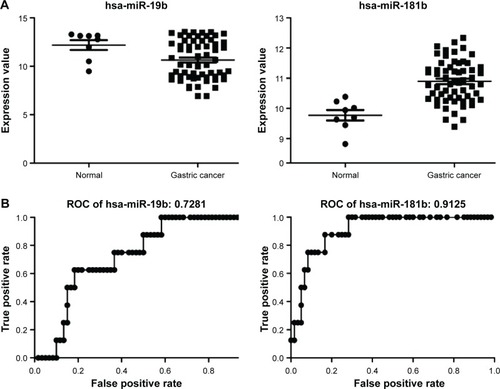
Table 4 Network topological features of 15 pathways
Table 5 Network topological features of the top 15 risk genes with highest degrees
Table 6 Network topological features of the top 15 differentially expressed miRNAs with highest degrees