Figures & data
Figure 1 Gyromagnetic field strength distribution varying with time using a CKJ-II (QLX-II) Gyromagnetic Therapy Machine.
Notes: Gyromagnetic field strength varied with time in the target area and obeyed the distribution regularity of a sine curve. The rotating frequency of the gyromagnetic field was 6 Hz, the maximum field strength was 300 mT, and the magnetic flux density was 8.3 mT/HzCitation2.
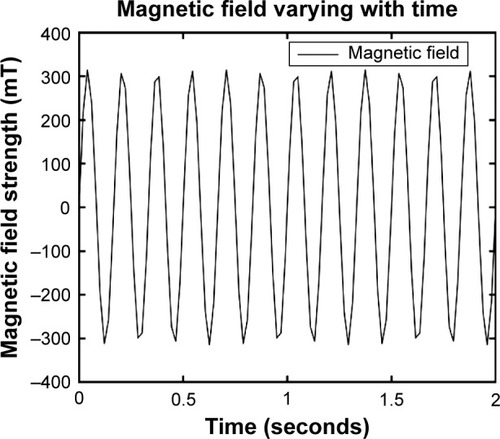
Figure 2 Effect of gyromagnetic fields on cell proliferation in PC-3 cells.
Notes: (A) Quantitative analysis of cell number counting assayed with CCK-8 in PC-3 cells after 24 hours treatment with a gyromagnetic field from the normal control (NC) group and the gyromagnetic field (GMF) groups with treatment times of 1, 5, 10, and 20 minutes (n=3). (B) Cell numbers were checked 24 hours after each treatment with a gyromagnetic field in PC-3 cells from the NC group and cells treated with a magnetic field for 10 minutes each time (GMF 10 minutes, once a day); (n=3). (C) Ki67 (red) immunofluorescence staining in PC-3 cells 24 hours after treatment with a gyromagnetic field from the NC group and cells treated once with a magnetic field for 10 minutes (GMF 10 minutes). Nuclei were labeled with 4′,6-diamidino-2-phenylindole (DAPI) (blue). Scale bars=50 μm, 200×. (D) Quantitative data of Ki67-positive cell number per high power field (HPF) by Image-Pro plus (n=3). *P<0.05 when compared with the NC group.
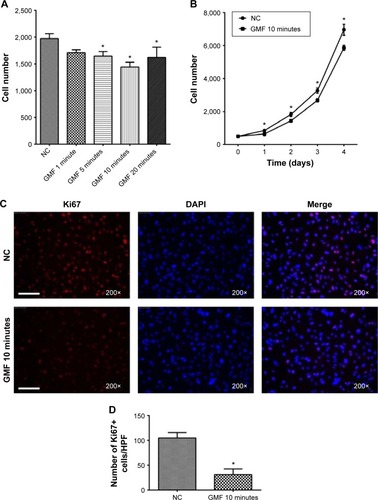
Figure 3 Effect of gyromagnetic fields on Akt signaling in PC-3 cells.
Notes: (A) Western blot analysis for phospho-Akt and Akt expression in PC-3 cells 24 hours after treatment with a gyromagnetic field from the normal control (NC) group and the gyromagnetic field (GMF) groups with treatment times of 1, 5, 10, and 20 minutes. (B) Quantitative data of band intensity for phospho-Akt and Akt by ImageJ (n=3). *P<0.05 when compared with the NC group.
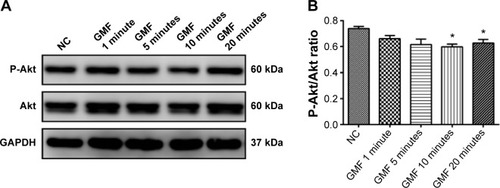
Figure 4 Effect of gyromagnetic fields on cell apoptosis in PC-3 cells.
Notes: (A) Flow cytometry analysis using an Annexin V-PE/7-AAD Apoptosis Detection Kit on PC-3 cells 24 hours after treatment with a gyromagnetic field from the normal control (NC group) and the gyromagnetic field (GMF) groups with treatment times of 1, 5, 10, and 20 minutes. (B) Quantitative data of cell apoptosis rate by FlowJO (n=3). Cells in late apoptosis were both Annexin V-PE positive and 7-AAD positive (Q2), and cells in early apoptosis were Annexin V-PE positive and 7-AAD negative (Q3). *P<0.05 when compared with the NC group.
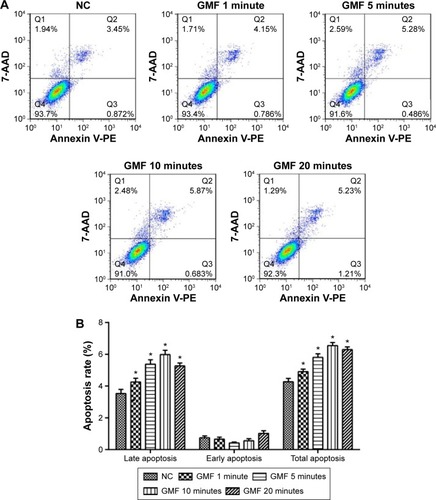
Figure 5 Effect of gyromagnetic fields on p38 MAPK/Caspase in PC-3 cells.
Notes: (A) Western blot analysis for phospho-p38 MAPK, p38 MAPK, and Cleaved Caspase-9 expression in PC-3 cells 24 hours after treatment with a gyromagnetic field from the normal control (NC) group and the gyromagnetic field (GMF) groups with treatment times of 1, 5, 10, and 20 minutes. (B and C) Quantitative data of band intensity for phospho-p38 MAPK, p38 MAPK, and Cleaved Caspase-9 by ImageJ (n=3). (D) Cleaved Caspase-3 (red) immunofluorescence staining in PC-3 cells at 24 hours after treatment with a gyromagnetic field from the NC group and cells treated once with a magnetic field for 10 minutes (GMF 10 minutes). Nuclei were labeled with 4′,6-diamidino-2-phenylindole (DAPI) (blue). Scale bars =50 μm, 200×. (E) Quantitative data of Cleaved Caspase-3-positive cell number per high power field (HPF) by Image-Pro plus (n=3). *P<0.05 when compared with the NC group.
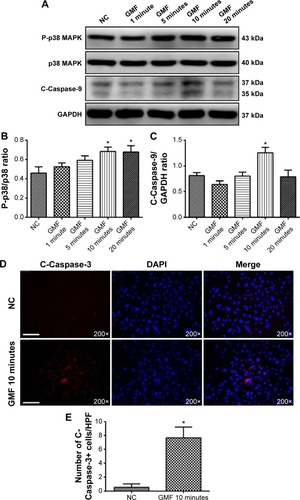
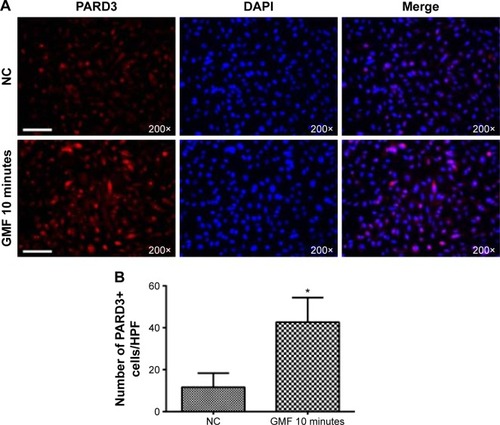
Figure 6 Effect of gyromagnetic fields on PARD3 protein in PC-3 cells.
Notes: (A) PARD3 (red) immunofluorescence staining in PC-3 cells 24 hours after treatment with a gyromagnetic field from the normal control (NC group) and cells treated once with a magnetic field for 10 minutes (GMF 10 minutes). Nuclei were labeled with 4′,6-diamidino-2-phenylindole (DAPI) (blue). Scale bars =50 μm, 200×. (B) Quantitative data of PARD3-positive cell number per high power field (HPF) by Image-Pro plus (n=3). *P<0.05 when compared with the NC group.