
Figures & data
Figure 1 FTIR spectra of (a) hyaluronan, (b) Sargassum muticum, and (c) HA/ZnO nanocomposite.
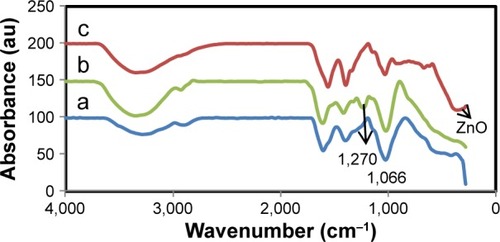
Figure 2 FESEM image of the HA/ZnO nanocomposite.
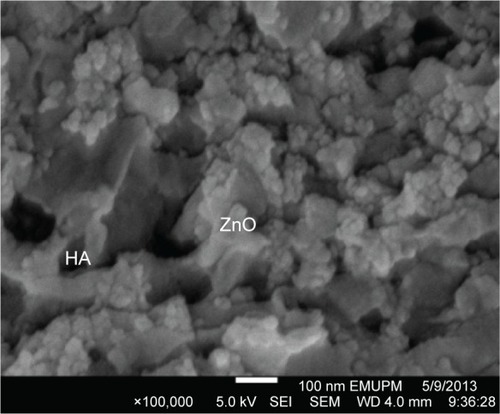
Figure 3 Morphological characteristic of HA/ZnO nanocomposite.
Abbreviations: TEM, transmission electron microscope; HA/ZnO, hyaluronan/zinc oxide; Std dev, standard deviation.
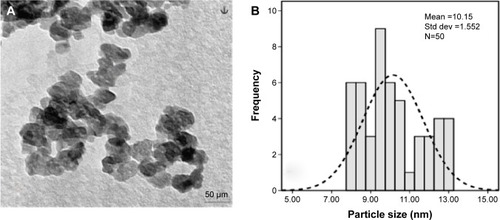
Figure 4 X-ray diffraction pattern of the HA/ZnO nanocomposite.
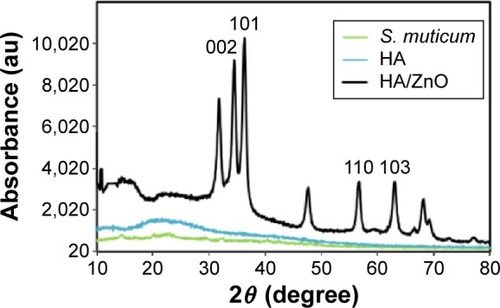
Figure 5 UV–vis absorption spectrum of the HA/ZnO nanocomposite.
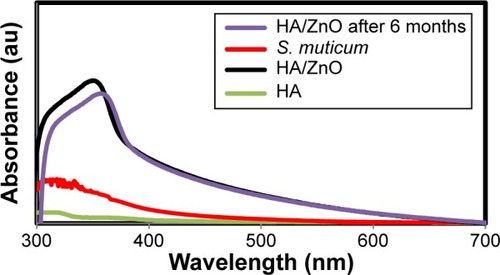
Figure 6 The polydispersity index of the HA (1) and HA/ZnO (2) nanocomposite.
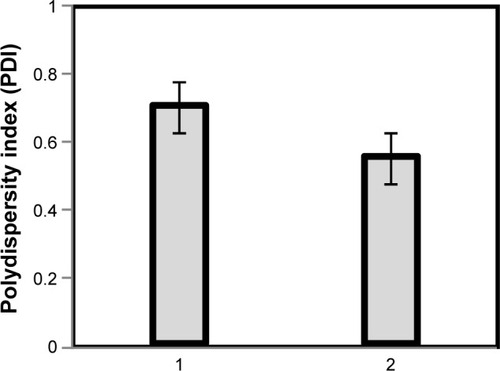
Figure 7 Cytotoxic effect of HA/ZnO nanocomposite and Cisplatin using 3-(4,5-dimethylthiazol-2-yl)-2,5-diphenyltetrazolium bromide on various human cell lines.
Abbreviations: HA/ZnO, hyaluronan/zinc oxide; h, hours; MTT, 3-(4,5-dimethylthiazol-2-yl)-2,5-diphenyltetrazolium bromide.
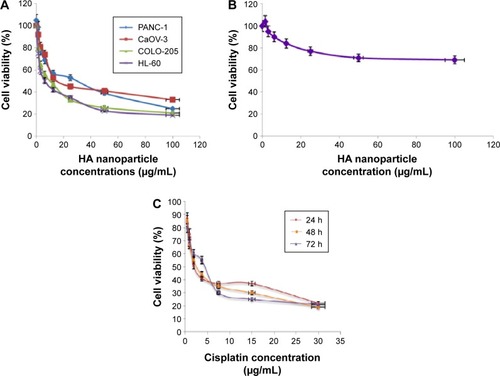
Figure 8 Fluorescent micrograph of AO/PI double-stained HL-60 cells that were treated with HA/ZnO nanocomposite.
Abbreviations: AO/PI, acridine orange/propidium iodide; HL-60, acute promyelocytic leukemia cells; HA/ZnO, hyaluronan/zinc oxide; VC, viable cells; BL, membrane blebbing; CC, chromatin condensation; MN, marginated nucleus; EA, early apoptotic cells; FN, fragmented nucleus; LA, late apoptotic cells; AB, apoptotic body.
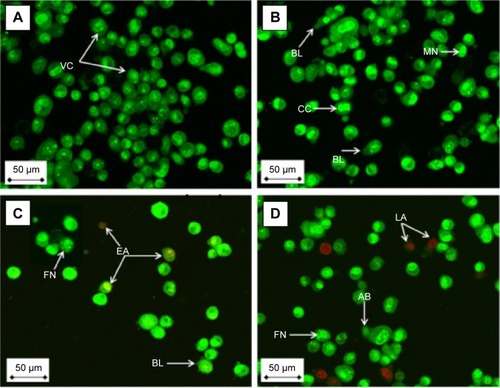
Figure 9 Flow cytometric analysis of apoptosis induction by HA/ZnO nanocomposite in HL-60 cells after staining with FITC-conjugated annexin-V and PI.
Abbreviations: HA/ZnO, hyaluronan/zinc oxide; HL-60, acute promyelocytic leukemia cells; FITC, fluorescein isothiocyanate; PI, propidium iodide; h, hours.
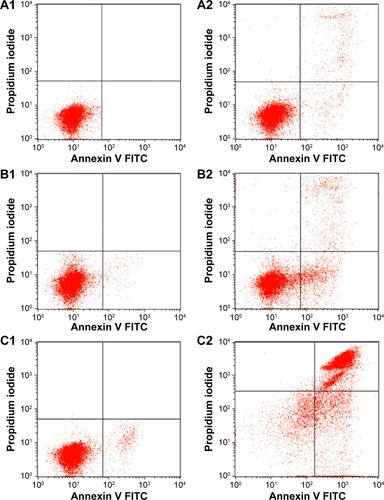
Table 1 Flow cytometric analysis of HL-60 cells treated with HA/ZnO nanocomposite
Figure 10 Cell cycle analysis of HL-60 cells treated with HA/ZnO nanocomposite after staining with PI.
Abbreviations: HL-60, acute promyelocytic leukemia cells; HA/ZnO, hyaluronan/zinc oxide; PI, propidium iodide; h, hours.
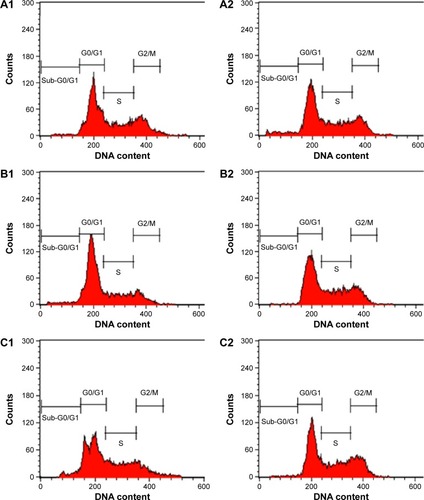
Table 2 Flow cytometric analysis of HL-60 cells treated with HA/ZnO nanocomposite
Figure 11 Effects of HA/ZnO nanocomposite treatment on HL-60 cell caspase-3 and -9.
Abbreviations: HA/ZnO, hyaluronan/zinc oxide; HL-60, acute promyelocytic leukemia cells; h, hours; SD, standard deviation.
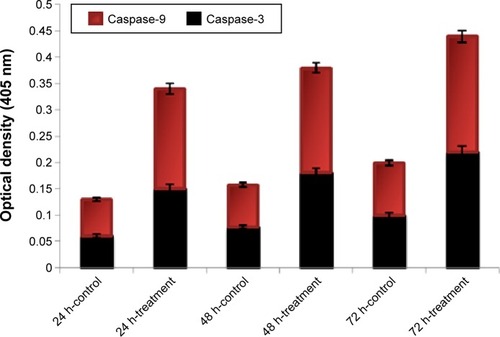
Table 3 Caspases spectrophotometric analysis of HL-60 cells treated with HA/ZnO nanocomposite for 24 h, 48 h, and 72 h