Figures & data
Table 1 US National Cancer Institute grading for diarrhea
Figure 1 Identification of included studies in this systematic review and meta-analysis.
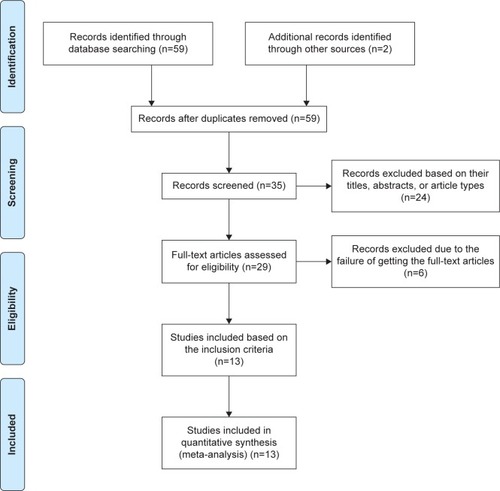
Table 2 Characteristics of studies included in the meta-analysis
Figure 2 Forest plot of the total incidence of all-grade diarrhea of patients with carcinomas receiving vandetanib.
Abbreviation: ES, effect size.
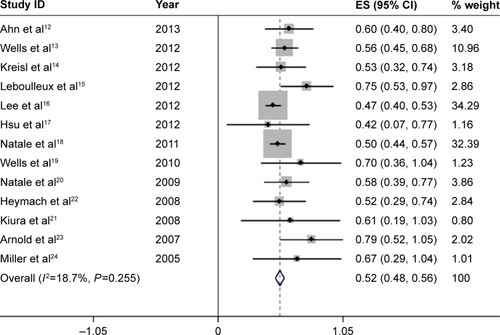
Figure 3 Forest plot of the total incidence of high-grade diarrhea of patients with carcinomas receiving vandetanib.
Abbreviation: ES, effect size.
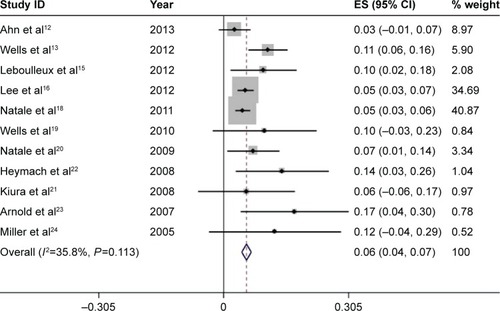
Figure 4 Forest plot of the relative risk (RR) of all-grade diarrhea events.
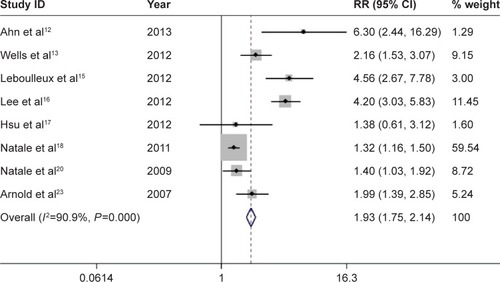
Figure 5 Forest plot of the relative risk (RR) of high-grade diarrhea events.
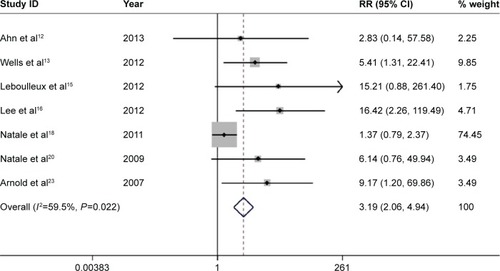
Figure S1 Forest plot of the total incidence of all-grade diarrhea of patients with non-small-cell lung cancer receiving vandetanib.
Notes: The size of the gray square corresponded to the weight of the study in the meta-analysis. The horizontal line represented the 95% confidence interval (CI) and the vertical dotted line showed the total incidence of all-grade diarrhea. Since heterogeneity test indicated no heterogeneity, the total incidence of all-grade diarrhea was calculated using the fixed-effects model.
Abbreviation: ES, effect size.
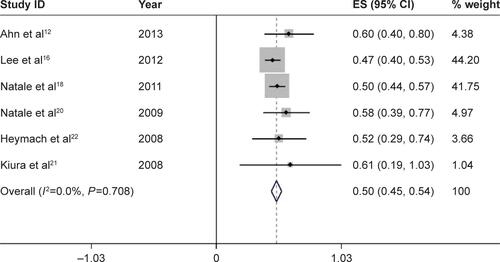
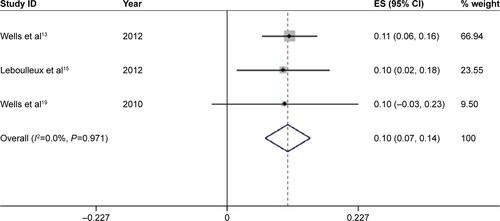
Figure S2 Forest plot of the total incidence of high-grade diarrhea of patients with non-small-cell lung cancer receiving vandetanib.
Notes: The size of the gray square corresponded to the weight of the study in the meta-analysis. The horizontal line represented the 95% confidence interval (CI) and the vertical dotted line showed the total incidence of high-grade diarrhea. Since heterogeneity test indicated no heterogeneity, the total incidence of high-grade diarrhea was calculated using the fixed-effects model.
Abbreviation: ES, effect size.
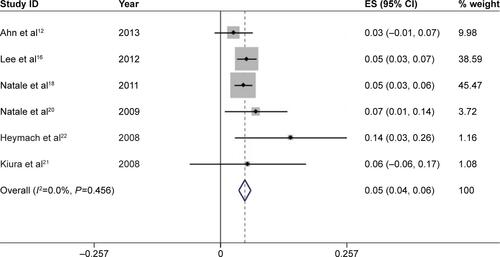
Figure S3 Forest plot of the total incidence of all-grade diarrhea of patients with thyroid cancer receiving vandetanib.
Notes: The size of the gray square corresponded to the weight of the study in the meta-analysis. The horizontal line represented the 95% confidence interval (CI) and the vertical dotted line showed the total incidence of all-grade diarrhea. Since heterogeneity test indicated no heterogeneity, the total incidence of all-grade diarrhea was calculated using the fixed-effects model.
Abbreviation: ES, effect size.
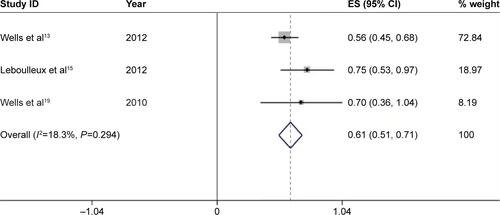
Figure S4 Forest plot of the total incidence of high-grade diarrhea of patients with thyroid cancer receiving vandetanib.
Notes: The size of the gray square corresponded to the weight of the study in the meta-analysis. The horizontal line represented the 95% confidence interval (CI) and the vertical dotted line showed the total incidence of high-grade diarrhea. Since heterogeneity test indicated no heterogeneity, the total incidence of high-grade diarrhea was calculated using the fixed-effects model.
Abbreviation: ES, effect size.