Figures & data
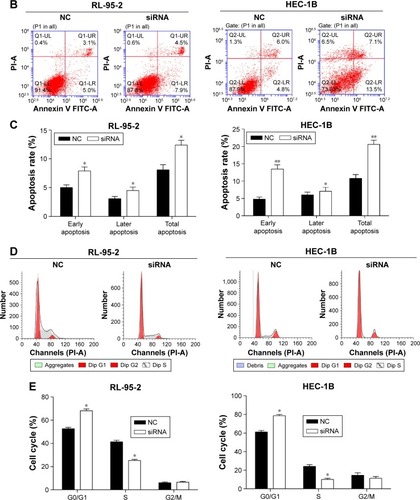
Figure 1 Classification of the identified proteins by GO database.
Notes: (A) Cellular component, (B) molecular function, and (C) biological process.
Abbreviation: GO, gene ontology.
Abbreviation: GO, gene ontology.
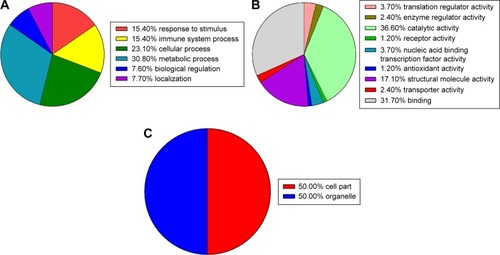
Figure 2 Representative figure showing differential isotopic labeling and LC-MS/MS.
Notes: Representative data for an upregulated protein, HSPA8. The continuous series of the b- and y-ions used for the identification of the peptide fragment.
Abbreviation: LC-MS/MS, Liquid chromatography tandom-mass spectrometry.
Abbreviation: LC-MS/MS, Liquid chromatography tandom-mass spectrometry.
Table 1 KEGG pathway in endometrial carcinoma
Table 2 A partial list of novel molecules found to be highly expressed in the endometrial carcinoma tissue proteome
Figure 3 The expression of identified differentially expressed molecules in endometrial carcinoma (tumor) and pericarcinous tissue (normal).
Notes: The mRNA expression of (A) CCT7, (B) HSPA8, (C) PCBP2, (D) LONP1, (E) PFN1, and (F) EEF2 was detected by qRT-PCR (n=10). (G) The expression of HSPA8 in protein level was also detected by Western blot (n=4). *P<0.05, **P<0.01, ***P<0.001, and ****P<0.0001 vs normal.
Abbreviation: qRT-PCR, quantitative real-time polymerase chain reaction.
Abbreviation: qRT-PCR, quantitative real-time polymerase chain reaction.
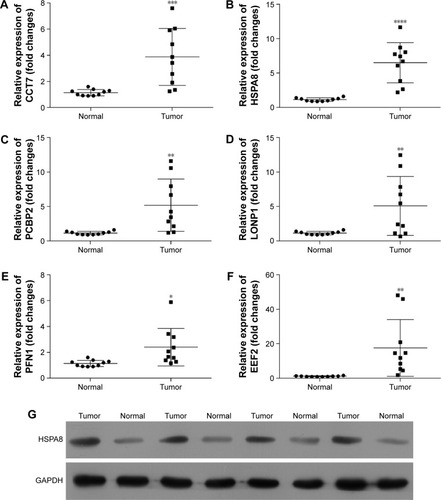
Figure 4 Screening of HSPA8 siRNA for knockdown of HSPA8 in RL-95-2 and HEC-1B cells.
Notes: RL-95-2 cells were transfected with 50 µM, 100 µM, and 200 µM HSPA8 siRNA (768, 1,112, and 1,509) or nontargeting negative control (NC). Then, the mRNA expression of HSPA8 was performed in HSPA8-768 siRNA-transfected RL-95-2 and HEC-1B cells. (A) HSPA8-768 at 50 µM, 100 µM, and 200 µM significantly suppressed the mRNA expression of HSPA8. (B) Western blot confirmed the downexpression of HSPA8 in HSPA8-768 (100 µM)-transfected RL-95-2 and HEC-1B cells. *P<0.05 and **P<0.01 vs NC.
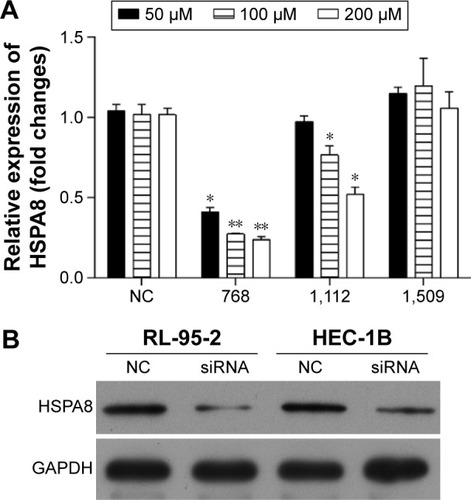
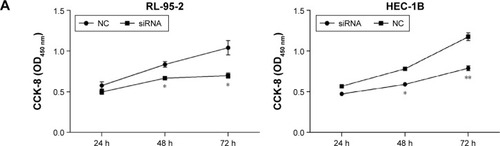
Figure 5 The proliferation, cell cycle, and apoptosis of HSPA8 siRNA-transfected RL-95-2 and HEC-1B cells.
Notes: After transfection for 48 hours, cell proliferation was detected by MTT assay (A); cell apoptosis was determined using the Annexin V-FITC/PI flow cytometry (B), and proportion of apoptosis cells was measured (C); cell cycle distribution in each group was measured by flow cytometry (D) and the cell cycle phase is shown in a bar graph (E) form with the G0/G1, S, and G2/M phases. *P<0.05, **P<0.01, and HSPA8 siRNA vs NC.
Abbreviations: PI, propidium iodide; NC, negative control; h, hours; FITC, fluorescein isothiocyanate.
Abbreviations: PI, propidium iodide; NC, negative control; h, hours; FITC, fluorescein isothiocyanate.