Figures & data
Figure 1 Carvacrol suppresses proliferation in human tongue cancer cells.
Notes: (A) Chemical structure of carvacrol (5-isopropyl-2-methylphenol). Tca-8113 cells (B) and SCC-25 cells (C) were cultured with the indicated concentrations of carvacrol in 96-well plates. After 24 hours (h), the cells were treated with MTT for 4 hours, and absorbance was measured. Results represent the mean ± standard deviation of three experiments done in triplicate. *P<0.05, **P<0.01 vs the Tca-8113 control group. (D) Carvacrol reduces s-phase of Tca-8113 cells compared to control cells. (E, F) Tca-8113 cells were treated with various concentrations of carvacrol (0~80 µM) for 24 hours and then examined for expression of P21, CCND1, CDK4, and the unchanged expression of CDK2 and CDK6 by Western blot analysis. β-actin was used as an internal control for equal amount of total proteins. (G) Colony formation assay of Tca-8113 cells.
Abbreviation: DMSO, dimethyl sulfoxide.
Abbreviation: DMSO, dimethyl sulfoxide.
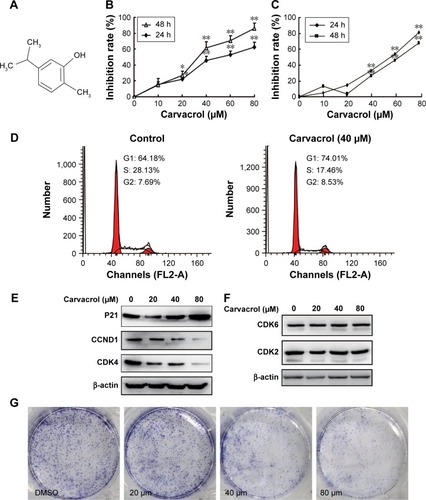
Figure 2 Carvacrol promoted cell apoptosis in Tca-8113 cells.
Notes: (A) The percentage of apoptotic cells was quantitated by flow cytometry. (B) The expression of Cox2, Bcl-2, and Bax proteins was analyzed by Western blotting. (C) Tca-8113 cells treated with carvacrol were subjected to Hoechst 33258 staining and viewed under a microscope. Arrows show apoptotic morphologic changes (chromatin condensed). (Original magnifcation: ×100).
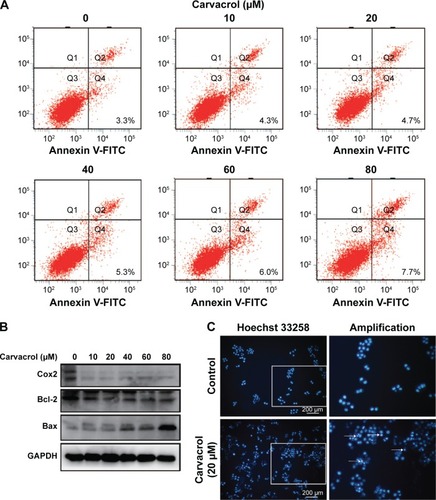
Figure 3 Carvacrol inhibited the adherence of Tca-8113 cancer cells.
Notes: Cells’ adherence force was evaluated by adherence assay in 60 minutes (A) or 100 minutes (B). The attached cells were fixed and stained, and ten random fields were counted. Magnification ×200. Scale bars: 200 µM. Also shown is the number of adherent cells from three independent experiments. **P<0.01 using Student’s t-test.
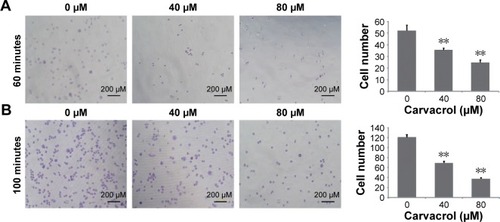
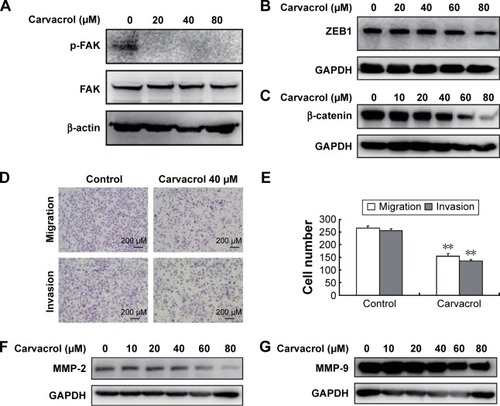
Figure 4 Carvacrol inhibits Tca-8113 cell migration and invasion.
Notes: (A) The expression of p-FAK and FAK proteins was analyzed by Western blotting in carvacrol-treated Tca-8113 cells. (B, C) Expression of β-catenin and ZEB1 in carvacrol-treated Tca-8113 cells. Then, Tca-8113 cells were treated by control or 40 μM of carvacrol for 24 hours, respectively. (D) Transwell assay analyses of the migration or invasion potential of Tca-8113 cells. Magnification ×200. (E) Numbers of migratory or invasive cells (mean ± standard deviation, n=5, “n” means five randomly chosen fields). **P<0.01. (F, G) Tca-8113 cells were treated with 0 to 80 μM of carvacrol for 24 hours. MMP-2 and MMP-9 levels were determined by Western blotting.