Figures & data
Figure 1 Scheme of postgastrectomy reconstructions.
Notes: (A) Roux-en-Y reconstruction and (B) “J-pouch” reconstruction.
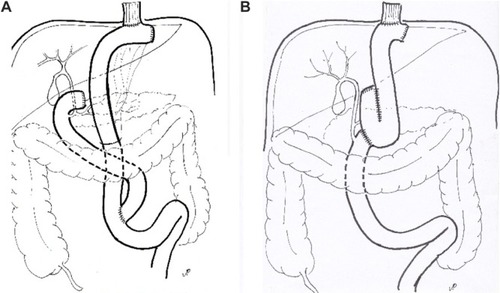
Figure 2 The CONSORT diagram showing flow through the trial.
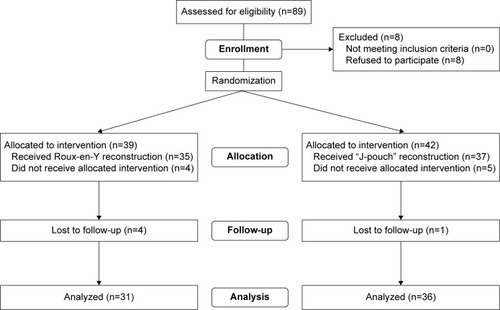
Table 1 Age, gender, and cancer stage of all patients included into the trial
Table 2 Selected symptoms occurrence after gastrectomy
Figure 3 Normal probability plot comparing the distribution of data from evacuation of “J-pouch” and Roux-en-Y reconstruction with normal distribution.
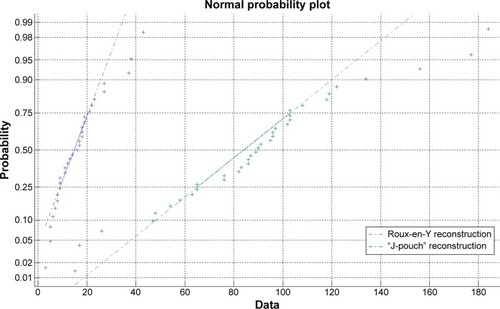
Table 3 QoL and length of evacuation after gastrectomy within both study groups
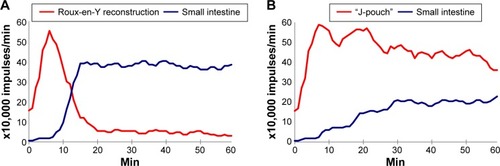
Figure 4 Examples of postgastrectomy reconstruction emptying curves (corrected for physical radioisotopic decay) obtained by dynamic scintigraphy after ingestion of semisolid test meal labeled with 99mTc-sulfur colloid.
Notes: Red curve – radioactivity detected in reconstructed segment; blue curve – radioactivity detected in small intestine beyond reconstruction. (A) Roux-en-Y reconstruction and (B) “J-pouch” reconstruction.