Figures & data
Figure 1 Diagram of the timeline (in days) of oral (PO) and intratumoral (IT) treatments given to mice bearing subcutaneous (SQ) rhabdomyosarcomas (RMS). Day 0 was designated as the first day that IT treatment was administered. Subsets of mice were euthanized on Days 4 and 7 for sample collection. The shortest and longest survival times were Day 11 and Day 31, respectively.
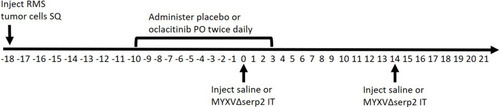
Table 1 Primer Sequences and Specific PCR Parameters Used to Detect MYXVΔserp2 DNA in Tissues
Table 2 Tumor Histology Grading Schemes
Figure 2 (A) Photomicrographs showing cytopathic effects (phase) and recombinant protein expression (fluorescence) 48 h post-inoculation (hpi) of RK-13 cells and U21089 cells with recombinant MYXV expressing tomato red fluorescent protein [multiplicity of infection (moi) = 0.1 and 1 virus particle/cell]. (B) Multi-step viral growth curves. U21089 cells were inoculated with MYXV or MYXVΔserp2 (moi = 0.01). Samples were collected at 0, 12, 24, 48, 72, and 96 hpi then plaqued onto RK-13 cells. The number of viral plaque-forming units (pfu) per U21089 cell was calculated from the number of foci that formed in RK-13 cell monolayers. (C) Viability of U21089 cells after inoculation with myxoma virus (MYXV) or MYXVΔserp2 (moi = 1) expressed as a percentage of viable mock infected U21089 cells. Error bars indicate standard error of the mean.
![Figure 2 (A) Photomicrographs showing cytopathic effects (phase) and recombinant protein expression (fluorescence) 48 h post-inoculation (hpi) of RK-13 cells and U21089 cells with recombinant MYXV expressing tomato red fluorescent protein [multiplicity of infection (moi) = 0.1 and 1 virus particle/cell]. (B) Multi-step viral growth curves. U21089 cells were inoculated with MYXV or MYXVΔserp2 (moi = 0.01). Samples were collected at 0, 12, 24, 48, 72, and 96 hpi then plaqued onto RK-13 cells. The number of viral plaque-forming units (pfu) per U21089 cell was calculated from the number of foci that formed in RK-13 cell monolayers. (C) Viability of U21089 cells after inoculation with myxoma virus (MYXV) or MYXVΔserp2 (moi = 1) expressed as a percentage of viable mock infected U21089 cells. Error bars indicate standard error of the mean.](/cms/asset/6dfc9705-d59d-416a-a3ac-a75a1863608b/donv_a_252727_f0002_c.jpg)
Figure 3 Tumor growth. (A) Tumor volume on the day of the first intratumoral injection (Day 0) and (B) average tumor growth rate calculated from U21089 cell injection until euthanasia in mice treated with phosphate buffered saline (PBS), MYXVΔserp2, and oclacitinib with MYXVΔserp2 (O+MYXVΔserp2). Error bars indicate mean and standard deviation.
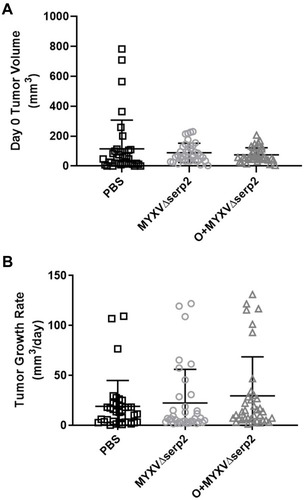
Figure 4 Representative images of subcutaneous rhabdomyosarcoma (RMS) tumors on Day 2 (A-C) and Day 19 (D-F) after the first intratumoral MYXVΔserp2 injection. Clinical signs associated with the tumors included erythema (A, B, D), swelling (B, E), ecchymosis (C, D, E), significant tumor development (D, E), and ulceration (F).
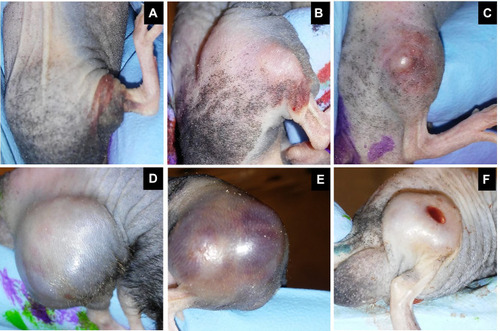
Figure 5 Contingency graphs indicating the number of mice with and without clinical signs of limb swelling, hematoma formation, erythema, and/or ecchymosis in each treatment group on (A) the day of the first intratumoral injection (Day 0) and (B) Day 4. On Day 0, the ratio of mice treated with oclacitinib with MYXVΔserp2 (O+MYXVΔserp2) that had clinical signs was higher than other treatment groups (*P-value = 0.02).
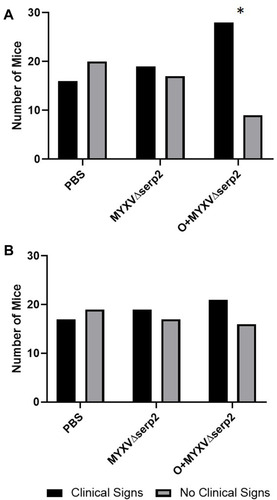
Table 3 Reason for Euthanasia of Mice with Rhabdomyosarcoma Allografts
Figure 6 Average histologic grades. (A) Necrosis, (B) hemorrhage, and (C) neutrophil grades were determined in histologic sections of tumors collected at the time of euthanasia. Error bars indicate standard error of the mean. *P-value of the t-test comparing phosphate buffered saline (PBS) to oclacitinib with MYXVΔserp2 (O+MYXVΔserp2) treatment = 0.02. †P-values of the t-tests comparing MYXVΔserp2 to O+MYXVΔserp2 treatment ≤ 0.05.
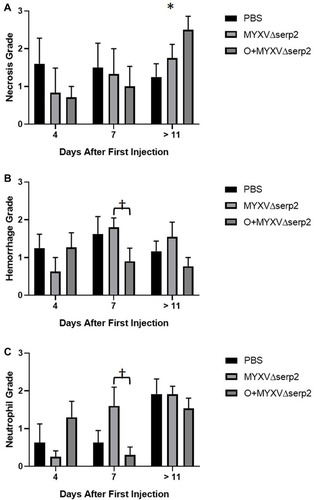
Table 4 Number of Samples in Which MYXV∆serp2 DNA Was Detected in Mouse Tissues by Droplet Digital PCR
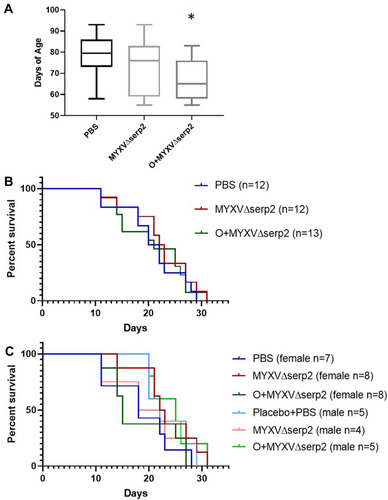
Figure 7 Graphs of (A) age on the day of U21089 cell injection and (B and C) survival outcomes. (A) Mice treated with oclacitinib with MYXVΔserp2 (O+MYXVΔserp2) were significantly younger than mice in other treatment groups (*P-value < 0.02). However, there were no significant differences between (B) median survival times in treatment groups. (C) Likewise, no differences were calculated when median survival times of male and female mice in each treatment group were analyzed independently.