
Figures & data
Table 1 Patient demographics
Table 2 Proove Opioid Risk test panel markers
Figure 1 Distribution of POR scores by OUD status.
Notes: OUD patients had significantly higher average POR scores compared to controls, P=7.97×10⁻³⁴. POR scores of OUD patients ranged from 8 to 46, with a mean of 17.6 (median =26, SD =5.07). POR scores of control patients ranged from 9 to 43, with a mean of 25.5 (median =17, SD =9.05).
Abbreviations: OUD, opioid use disorder; POR, Proove Opioid Risk; SD, standard deviation.
Abbreviations: OUD, opioid use disorder; POR, Proove Opioid Risk; SD, standard deviation.
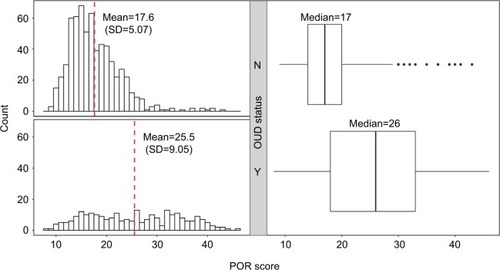
Figure 2 ROC curve of POR predicting OUD status.
Notes: At a POR score of ≥12, which is used to identify those at moderate and high risks, the POR algorithm has high sensitivity (95.7%) and low specificity (6.2%). At a POR score of ≥24, which is used to identify those at high risk, the sensitivity decreases to 55.4% and the specificity increases to 88.9%. The AUC of the ROC curve is 0.757 (95% confidence interval: 0.718–0.797), meaning that the POR algorithm is able to correctly diagnose OUD >75% of the time.
Abbreviations: AUC, area under the curve; OUD, opioid use disorder; POR, Proove Opioid Risk; ROC, receiver operating characteristic.
Abbreviations: AUC, area under the curve; OUD, opioid use disorder; POR, Proove Opioid Risk; ROC, receiver operating characteristic.
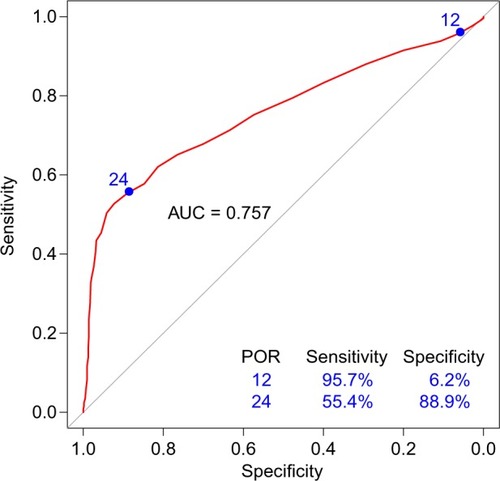
Figure 3 Performance of POR across different prevalence rates of OUD.
Notes: The consequences of increasing the POR score threshold to correctly identify OUD patients are decreased sensitivity and increased specificity. Conversely, decreasing the POR score threshold to correctly identify OUD patients results in an increased sensitivity and a decreased specificity. The POR performs equally well across different prevalence rates: 8% (population), 28% (cohort), and 50% (balanced).
Abbreviations: OUD, opioid use disorder; POR, Proove Opioid Risk.
Abbreviations: OUD, opioid use disorder; POR, Proove Opioid Risk.
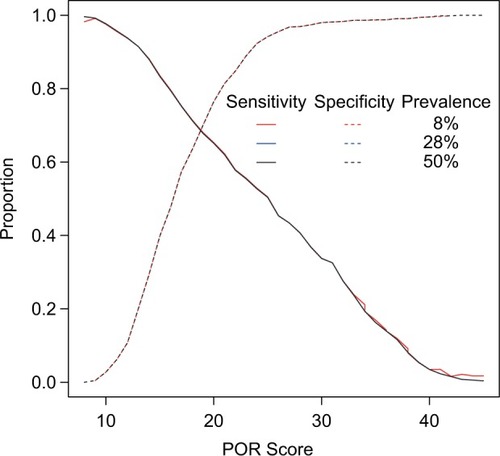
Figure 4 ORs of OUD in each POR risk stratification.
Notes: Patients at moderate risk (POR score 12–23) had on average 4.17 increased odds of OUD. Patients at high risk (POR score ≥24) had on average 16.5 increased odds of OUD.
Abbreviations: OR, odds ratio; OUD, opioid use disorder; POR, Proove Opioid Risk.
Abbreviations: OR, odds ratio; OUD, opioid use disorder; POR, Proove Opioid Risk.
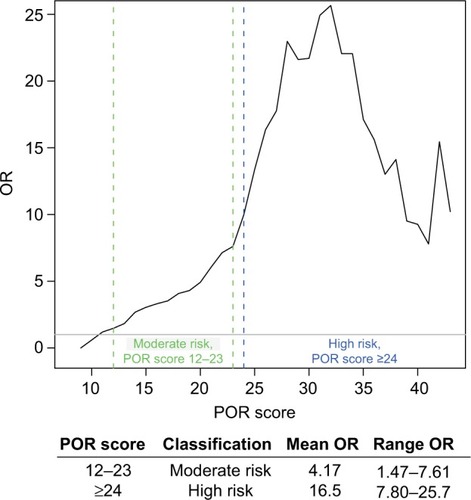
Figure 5 PLRs and NLRs of OUD across different prevalence rates.
Notes: As the POR score increases, so does the PLR of OUD diagnosis, ie, the likelihood of correct OUD diagnosis given a minimum POR score. The NLR is the likelihood of correct diagnosis of no OUD given a minimum POR score. For all POR scores <42, the NLR is <1. The PLR and NLR are comparable across different prevalence rates: 8% (population), 28% (cohort), and 50% (balanced).
Abbreviations: NLRs, negative likelihood ratios; OUD, opioid use disorder; PLRs, positive likelihood ratios; POR, Proove Opioid Risk.
Abbreviations: NLRs, negative likelihood ratios; OUD, opioid use disorder; PLRs, positive likelihood ratios; POR, Proove Opioid Risk.
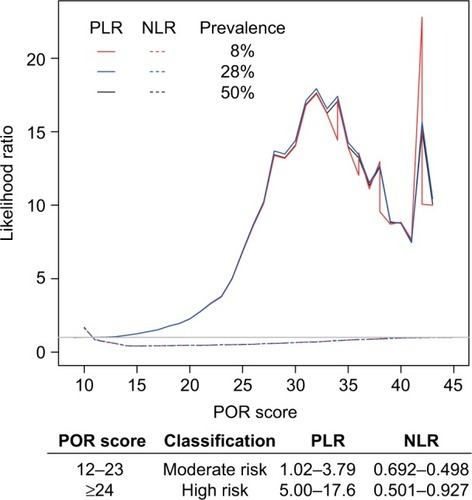
Table S1 Sensitivities and specificities of the POR algorithm using different cutoffs of POR scores to predict OUD