
Figures & data
Table 1 CYP2D6 alleles identified by the 5′nuclease assays compared to those of the Luminex XTag CYP2D6 v.3 and Roche AmpliChip P450 kit
Table 2 Validation of 5′ nuclease test panels
Table 3 Specificity of primer and probe sequences with optimized reaction concentrations
Figure 1 (A) Allelic discrimination plot of the CYP2D*41 assay, showing the 48 samples used for validating the test; X-axis: FAM fluorescence – wildtype probe; Y-axis: CalFluor gold 540 – mutant probe. Ambiguous sample is marked with a red circle, while black square represents “no template” control (NTC). (B) Sequence of the probe region (blue area) of the ambiguous sample. Green arrow marks the 2988G>A SNP, while the red arrow shows the location of the 2980C>T SNP.
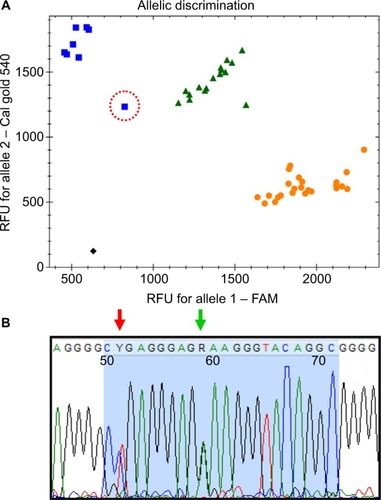
Table 4 Retest of CYP2D6*41 alleles based on the presence of the 2988G>A SNP