Figures & data
Figure 1 Flow chart of subjects, treatment approach, and outcome measures.
Abbreviations: ASI, The Addiction Severity Index; DSM-IV, The Diagnostic and Statistical Manual of Mental Disorders, Fourth Edition.
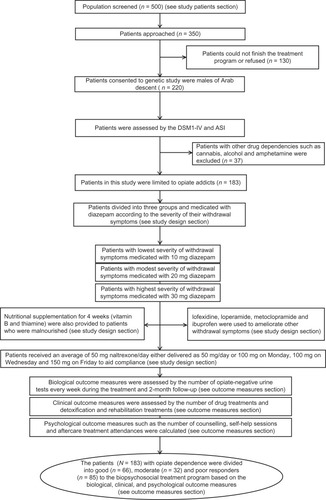
Table 1 List of SNPs within the OPRM1 gene, their positions, and genotyping data based on the whole cohort (N = 183)
Table 2 Details of the 183 opiate-dependent patients classified into three groups
Table 4 Association of OPRM1 SNPs with treatment outcome
Table 3 Differences in genotyping distribution of OPRM1 SNPs with frequency of opiate use