
Figures & data
Table 1 Example Categories of Cardiovascular Medicines/Drugs
Figure 1 Continued.
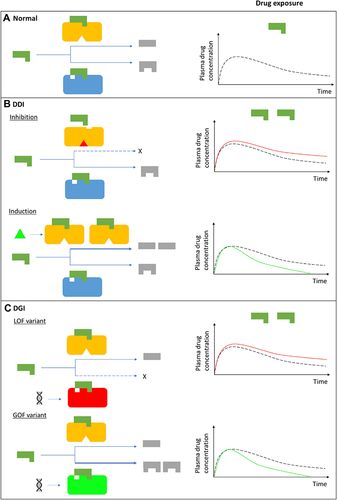
Figure 1 Drug-drug, drug-gene, and drug-drug-gene interactions.Citation13,Citation52 (A) Normal metabolism: expected drug exposure (black dotted line in plasma drug concentration–time curve, single exposure) for a drug/substrate that is metabolized by two cytochrome P450 (CYP) enzymes. (B) Drug–drug interaction (DDI): inhibition (eg null activity) or induction (eg increased enzyme copies) of CYP A by co-medications resulting in increased (red line in plasma drug concentration–time curve) or decreased (green line in plasma drug concentration–time curve) drug exposures, respectively. (C) Drug–gene interaction (DGI): genetic variation inactivates/reduces (loss-of-function/LoF variant) or increases (gain-of-function/GoF variant) CYP B activity resulting in increased or decreased drug exposures, respectively. (D) Drug-drug-gene interaction (DDGI): cumulative effects of comedications (DDIs) and genetic variations (DGIs). In a category 1 DDGI, a DDI and DGI on the same pathway (eg CYP A) and direction (eg inhibitor with a LOF variant) interact to significantly increase (or decrease) drug exposure while in a category 2 DDGI, the DDI and DGI act on different pathways but still in the same direction to also increase (or decrease) drug exposure. Lastly, category 3 comprises DDIs and DGIs with opposing effects (eg inhibitor with a GOF variant) that leads to increased (inhibitor effects greater than GOF variant effects), decreased (inhibitor effects lower than GOF variant effects) or unchanged (inhibitor effects similar to GOF variant effects) drug exposure. The above interactions also apply to bioactivation of prodrugs (in which decreased metabolism results in decreased systemic exposure) and other pathways (eg drug- and/or gene-mediated changes to drug transporters or drug targets). If a drug has a comparable clinical effect with its metabolites, the effects of metabolism-based DDIs, DGIs and DDGIs may not be apparent. Any compensation by CYP A for the loss (or increase) in CYP B’s activity, and vice-versa, is not depicted/accounted for in this over-simplified schematic.
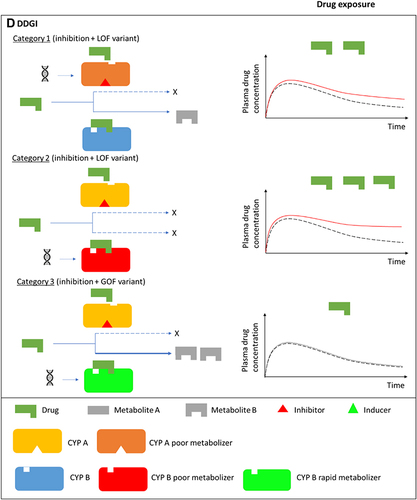
Table 2 Examples of Substrates, Inducers and Inhibitors for Cytochrome P450 Isoenzymes and Transportersa (Data from Turner et alCitation27)
Figure 2 Commonly used medications influenced by pharmacogenes. The bar chart shows the total number of prescriptions (top panel) or patients receiving the prescriptions (bottom panel) in 2019 in the United States. Corresponding ranks are shown in parentheses. Data from the ClinCalc DrugStats DatabaseCitation40 that used the Medical Expenditure Panel Survey 2013–2019 (Agency for Healthcare Research and Quality) as a prescription data source.
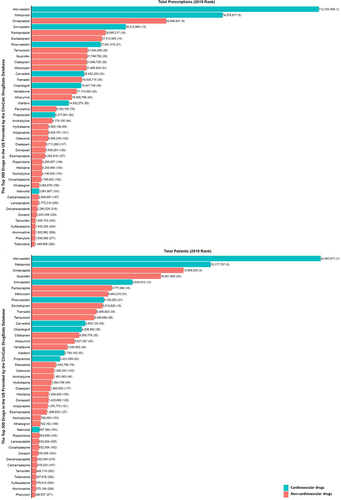
Table 3 A Summary of Clinical Implementation Pharmacogenetic Guidelines for Cardiovascular Drugs (Data from Abdullah-Koolmeesa et al)Citation30
Table 4 Examples of Drug–Drug–Gene Interactions Involving Cardiovascular medicinesCitation15,Citation31,Citation83
Box 1 Minimizing Drug–Drug Interactions (DDIs)Citation18
Table 5 Proposed Solutions to Clinical Practice Challenges