Figures & data
Table 1 Basic Information of Endometrial Cancer and Health Controls
Table 2 Basic Characteristics and Allele Model About Candidate SNPs in the BCL11A Gene
Table 3 The Effect of BCL11A SNPs on the Susceptibility to Endometrial Cancer
Table 4 Stratification Analysis by Age and BMI for the Effect of BCL11A SNPs on the Susceptibility to Endometrial Cancer
Figure 1 LD plots of six SNPs in the BCL11A gene. The number in the diamond indicates the D’ value of pairwise LD between SNPs.
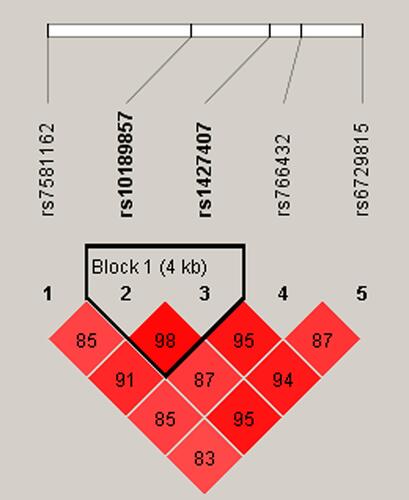
Table 5. SNP–SNP Interaction Models of the BCL11A Gene the Predisposition of Endometrial Cancer
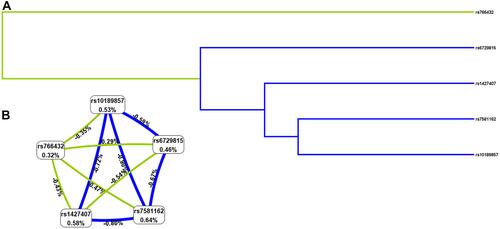
Figure 2 The dendrogram (A) and Fruchterman Reingold (B) of BCL11A SNP-SNP interaction for EC risk. (A) Short connections among nodes represent stronger redundant interactions. Green and blue color indicated weak interactions. (B) This graphical model describes the percent entropy explained by each SNP. Values in nodes represent the information gains of individual attribute (main effects). Values between nodes are information gains of each pair of attributes (interaction effects). Positive percent entropy indicates synergy whereas the negative percent entropy indicates redundancy.