Figures & data
Table 1 Survival Analysis of ACBD4 Gene in GSE14520 HBV-Related HCC Cohort
Table 2 Joint Effect Survival Analysis of ACBD4 Expression and Clinical Parameters in GSE14520 HBV-Related HCC Patients
Figure 1 Violin diagram of ACBD4 gene expression level distribution in normal human organ tissues from GTEx database.
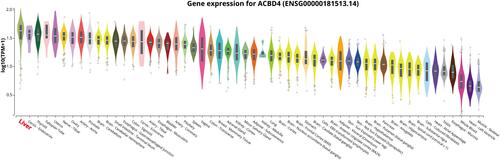
Figure 2 The diagnostic and prognostic values of ACBD4 in GSE14520 HBV-related HCC cohort. (A) Expression distribution of ACBD4 in tumor and adjacent paracancerous tissues; (B) the ROC curve of ACBD4 gene in distinguished tumor and adjacent paracancerous tissues; (C) Kaplan-Meier curve of ACBD4 in HBV-related HCC recurrence-free survival time; (D) Kaplan-Meier curve of ACBD4 in HBV-related HCC overall survival time.
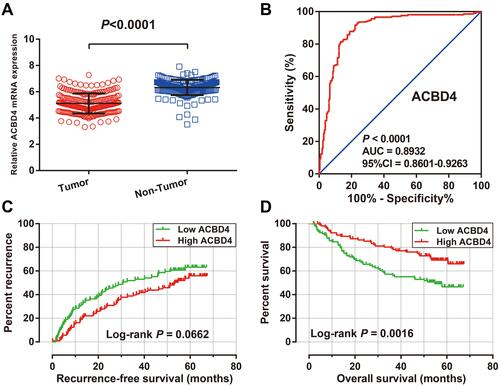
Figure 3 Stratified survival analysis results of ACBD4 gene in GSE14520 HBV-related HCC cohort.
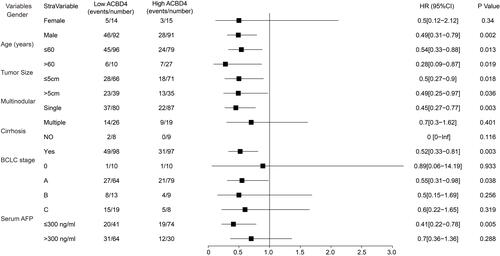
Figure 4 Joint effect survival analysis of ACBD4 expression and clinical parameters in GSE14520 HBV-related HCC patients. (A) Joint effect survival analysis of ACBD4 and tumor size; (B) Joint effect survival analysis of ACBD4 and cirrhosis; (C) Joint effect survival analysis of ACBD4 and BCLC stage; (D) Joint effect survival analysis of ACBD4 and serum AFP.
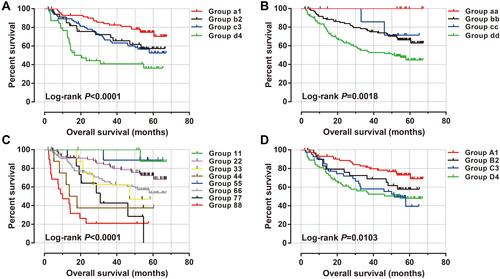
Figure 5 The nomogram of ACBD4 and clinical parameters in the GSE14520 HBV-related HCC cohort.
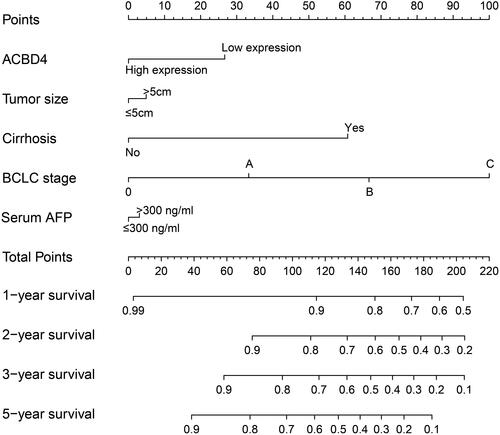
Figure 6 Prognostic value of ACBD4 gene in TCGA HCC cohort. (A) Kaplan-Meier curve of ACBD4 in HCC recurrence-free survival time; (B) Kaplan-Meier curve of ACBD4 in HCC overall survival time; (C) Kaplan-Meier curve of ACBD4 in HCC progression-free survival time; (D) Kaplan-Meier curve of ACBD4 in HCC disease-specific survival time.
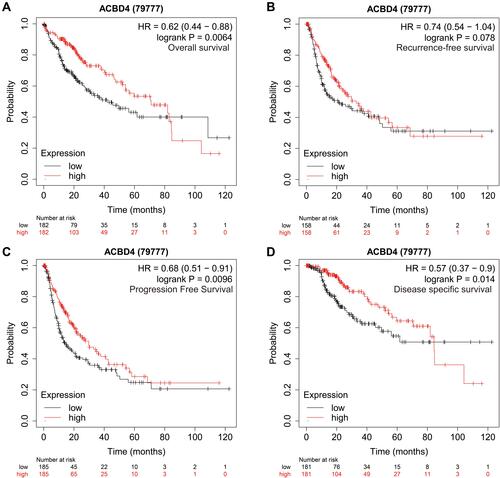
Table 3 Survival Analysis of ACBD4-rs4986172 in Guangxi HBV-Related HCC Patients
Table 4 Correlation Analysis Between ACBD4-rs4986172 and Clinical Parameters in Guangxi HBV-Related HCC Patients
Table 5 Joint Effect Survival Analysis of ACBD4-rs4986172 and Clinical Parameters in Guangxi HBV-Related HCC Patients
Figure 7 Prognostic value of ACBD4-rs4986172 in Guangxi HBV-related HCC cohort. (A) Kaplan-Meier curve of AA, AG and GG; (B) Kaplan-Meier curve of AA+AG and GG; (C) Kaplan-Meier curve of AA and AG+GG.
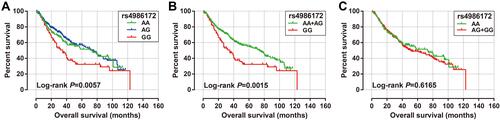
Figure 8 Stratified survival analysis results of ACBD4-rs4986172 in Guangxi HBV-related HCC cohort.
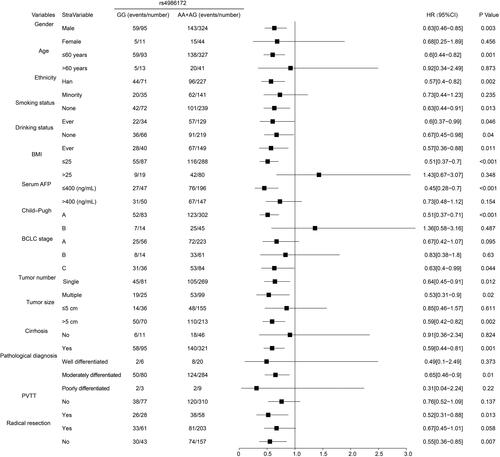
Figure 9 Joint effect survival analysis of ACBD4-rs4986172 and clinical parameters in Guangxi HBV-related HCC patients. (A) Joint effect survival analysis of rs4986172 and serum AFP; (B) Joint effect survival analysis of rs4986172 and BCLC stage; (C) Joint effect survival analysis of rs4986172 and PVTT; (D) Joint effect survival analysis of rs4986172 and radical resection. (E) Joint effect survival analysis of rs4986172 and tumor size; (F) Joint effect survival analysis of rs4986172 and tumor number.
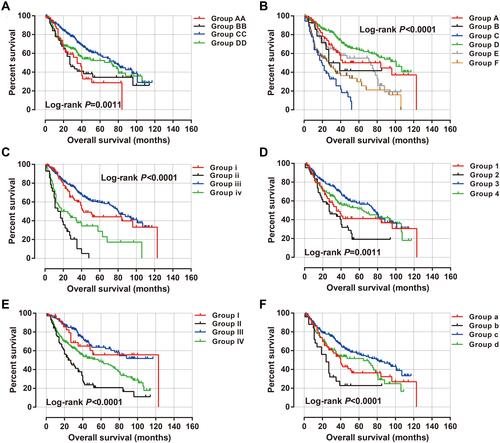
Figure 10 The nomogram of ACBD4-rs4986172 and clinical parameters in the Guangxi HBV-related HCC cohort. (A) AA, AG and GG genotypes in HBV-related HCC; (B) AA+AG and GG genotypes in HBV-related HCC.
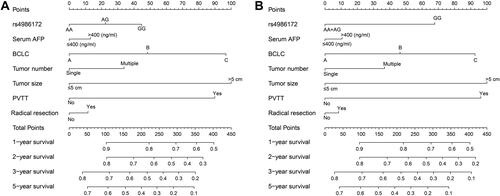
Figure 11 Genome-wide co-expression network of ACBD4 gene in HBV-related HCC tumor tissues of patients in GSE14520 cohort.
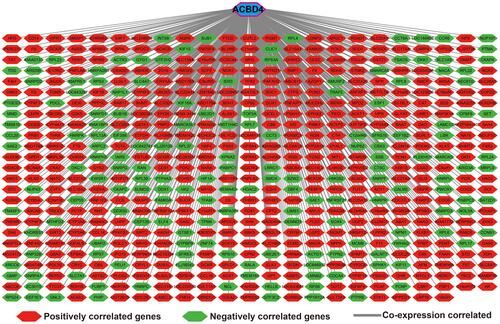
Figure 12 Volcano plot of DEGs between low- and high-ACBD4 expression groups.
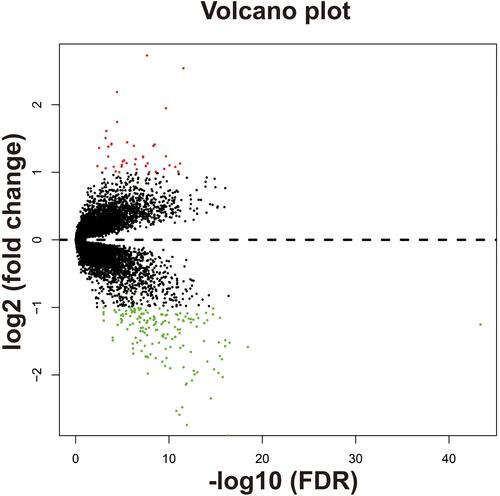
Figure 13 GSEA results between low- and high-ACBD4 expression groups by using c2 reference gene set. (A) nuclear receptor transcription pathway; (B) mTOR signaling up; (C) liver cancer recurrence down; (D) liver cancer poor survival down; (E) PPAR signaling pathway; (F) metabolism cytochrome P450; (G) oxidation by cytochrome P450; (H) bile acid and bile salt metabolism; (I) stress pathway; (J) fatty acid metabolism; (K) tumor invasiveness up; (L) metastasis up.
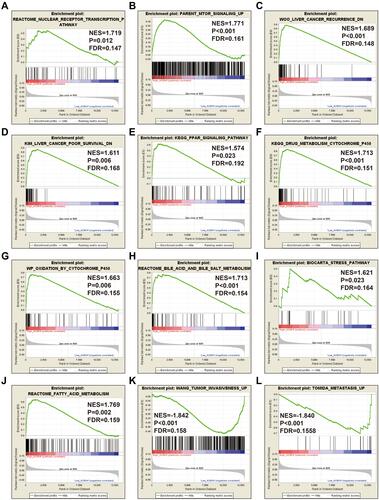
Figure 14 GSEA results between low- and high-ACBD4 expression groups by using c5 reference gene set. (A) fatty acid metabolic process; (B) polysaccharide catabolic process; (C) bile acid metabolic process; (D) alcohol catabolic process; (E) lipid accumulation in hepatocytes; (F) positive regulation of G protein coupled receptor signaling pathway; (G) fatty acid metabolic process; (H) lipoprotein metabolic process; (I) steroid metabolic process; (J) bile acid and bile salt transport; (K) drug metabolic process; (L) abnormality of hepatobiliary system physiology.
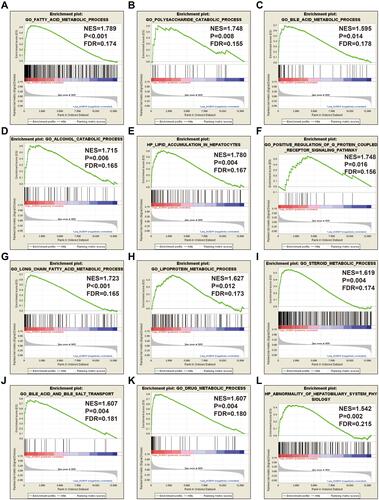
Figure 15 CMap result of ACBD4 in HCC. (A) Chemical construction of scopoletin; (B) Chemical construction of alfaxalone; (C) Chemical construction of bephenium hydroxynaphthoate; (D) Chemical construction of apramycin; (E) Chemical construction of 4,5-dianilinophthalimide; (F) Chemical construction of DL-thiorphan; (G) Chemical construction of aminohippuric acid; (H) Chemical construction of quinidine; (I) Summary table of CMap results.
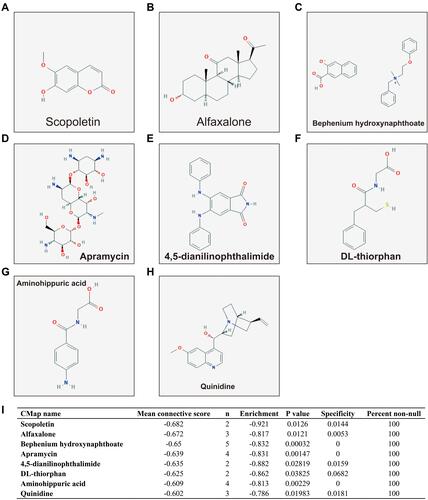
Figure 16 Drug-gene interaction network of compounds identified by CMap.
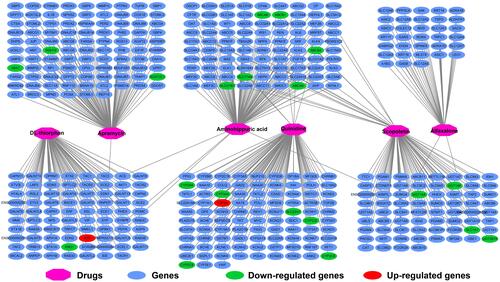
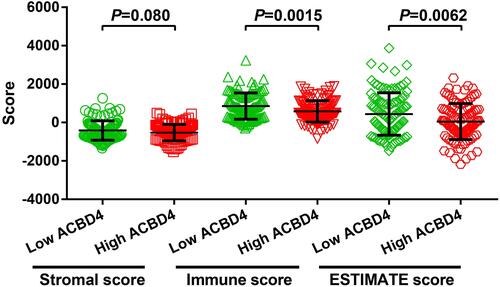
Figure 17 Score of ACBD4 gene in HBV-HCC immune microenvironment.