
Figures & data
Table 1 Clinical Information of the Subjects
Figure 1 The expression levels of IL-6 (A) and TGF-β (B) in controls and patients serum were measured by enzyme-linked immunosorbent assay. ***P < 0.001 versus the Control groups.
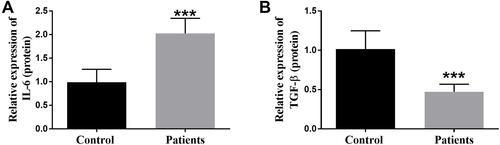
Table 2 Frequency Distribution of IL-6 Gene rs1800796 Genotype and Allele in Controls and Patients Groups
Table 3 Frequency Distribution of TGF-β Gene rs1982073 Genotype and Allele in Controls and Patients Groups