Figures & data
Table 1 Characteristics of Patients with CHD and Healthy Individuals
Table 2 The Basic Information and HWE About the Selected SNPs of BTNL2
Table 3 The Association Analysis Between Susceptibility of CHD and Single Nucleotide Polymorphism of BTNL2
Table 4 Haplotype Analysis of Candidate BTNL2 Genetic Polymorphisms with CHD Risk
Figure 1 Haplotype block map for the BTNL2 SNPs (rs117896888, rs41441651, rs41417449, rs28362680). (A) The numbers inside the diamonds indicate The D’ for pairwise analyses. (B) The numbers inside the diamonds indicate the R2 for pairwise analyses. The colors represent the degree of linkage disequilibrium: the redder the color, the stronger the linkage disequilibrium.
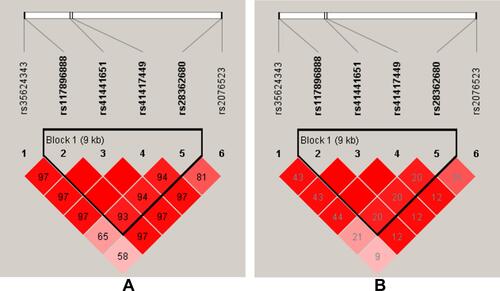
Table 5 BTNL2 SNP–SNP Interaction Models Analyzed by the MDR Method
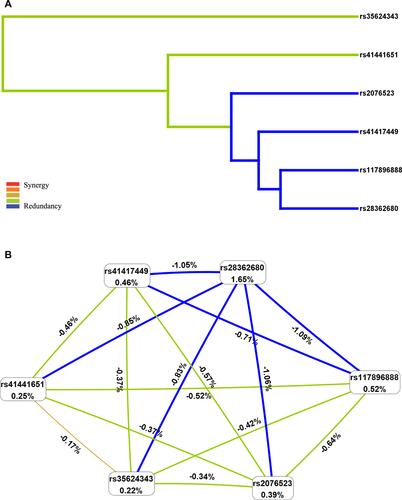
Figure 2 Multifactor dimensionality reduction (MDR) analysis of interaction between the candidate SNPs of BTNL2 ((rs35624343, rs117896888, rs41441651, rs41417449, rs28362680 and rs2076523). (A) SNP-SNP Interaction Dendrogram: the color represents the degree of redundancy or synergy between SNP-SNP; the closer the color is to red, the more synergy, and the closer to blue, the more redundancy. (B) Fruchterman-Reingold: values in nodes represent the IGs of individual attribute (main effects). Values between nodes are IGs of each pair of attributes (interaction effects).