Figures & data
Figure 1 Study workflow.
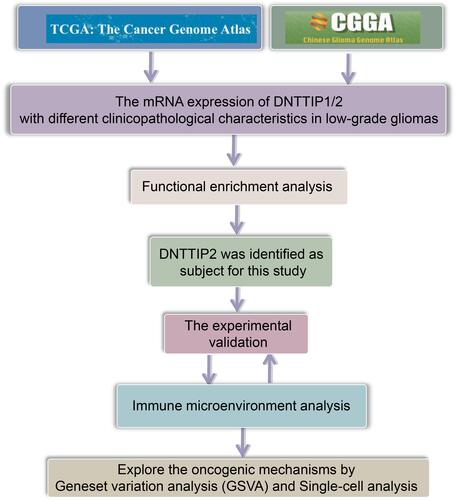
Figure 2 Prognosis analysis of DNTTIP1/2 mRNA expression in Pan-Cancers. (A and B) Prognosis analysis of DNTTIP1/2 in Pan-Cancers. (C) Kaplan-Meier survival analysis based on The Cancer Genome Atlas (TCGA)-Low-grade gliomas (LGG). (D) The relationship between DNTTIP1/2 expression status and clinicopathological characteristics in LGG. *P < 0.05, **P < 0.01, ***P < 0.001.
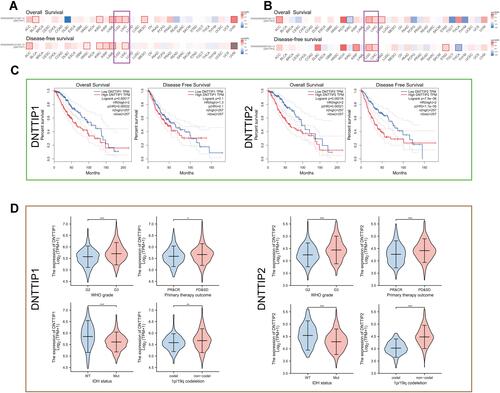
Figure 3 Enrichment analysis of DNTTIP1/2 and correlated genes. (A) GeneMINIA-based protein–protein interactions (PPI) with DNTTIP1/2 as the core. (B and C) Differences in DNTTIP1/2 expression in the low- and high-expression groups were analyzed using the “Limma” R package on The Cancer Genome Atlas (TCGA) dataset after which volcano plots were constructed. Red dots indicate positive correlations, green dots indicate negative correlations, and gray dots indicate that genes that did not correlate with DNTTIP1/2. (B) DNTTIP1; (C) DNTTIP2. (D) The “VennDiagram” R package was used to analyze correlations of common genes with DNTTIP1 and DNTTIP2. (E and F) Gene ontology (GO) (E) and Kyoto Encyclopedia of Genes and Genomes (KEGG) (F) enrichment analysis of DNTTIP1/2. Each row represents one cluster; color indicates significance, and gray color indicates non-significance. Heatmap showing the top 20 clusters correlated with DNTTIP1/2. (G) Network of DNTTIP2 and genes with DNTTIP2-linked expression (positive). (H–J) The hub module with the highest scores analyzed by Molecular Complex Detection (MCODE).
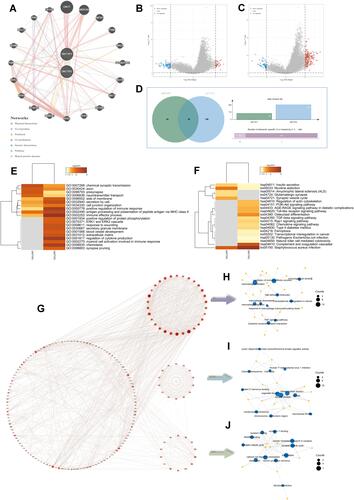
Figure 4 DNTTIP2 overexpression promotes a malignant phenotype in glioma. (A) DNTTIP2 protein expression in normal human glioma cells. (B) The transfection efficiency was verified by the GFP expression as well as the Western blot. Transfection efficiency is represented as percentages. (C) Clone formation ability of the glioma cells transfected with the NC, sh- DNTTIP2, and oe‐DNTTIP2. (D) Cell scratch migration assay of the migratory ability of each group of glioma cells. (E) Cell invasion was determined via a Transwell assay. (F) Illustration of the model for Tube formation assay. (G) Tubule formation of HUVECs and column graph of tubule formation index in different groups. (H) Schematic diagram of subcutaneous tumor models. (I) Xenograft mouse tumors (n= 6 mice per group). (J and K) Volumes (J) of xenograft tumors measured twice a week and weights (K) of xenograft tumors at completion of the study. Data are means ± SEM *p < 0.05; **p <0.01; ***p < 0.001; ****p < 0.001.
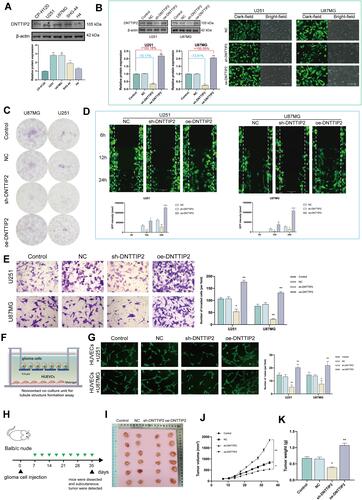
Figure 5 Immune landscape of LGG patients with different expression levels of DNTTIP2. (A) Spearman correlation between DNTTIP2 and 24 types of immune cells. Positive (red lollipop) and negative (blue lollipop) correlations. (B) Correlation between DNTTIP2 expression and immune cell infiltration, where the x-axis indicates the type of immune cell and the y-axis indicates the immune score (CIBERSORT scores) in different groups where different colors represent different groups. High-expression group (red) and low-expression group (blue). (C) Correlation between DNTTIP2 expression and immune cell numbers analyzed by TIMER. (D and E) Proportions of the TIC types in LGG samples based on (D) GSE28238 and (E) GSE45921. (F) Correlation of DNTTIP2 expression levels with macrophage abundance based on GSE28238 and GSE45921. (G) Diagram of co-culture system. (H) Double-immunofluorescence staining of M2 macrophage markers CD206 (red) and CD163 (green); nuclei are stained with DAPI (blue). Intensity of immunofluorescence (mean ± SEM). Data are means ± SEM *p<0.05; **p <0.01; ***p< 0.001.
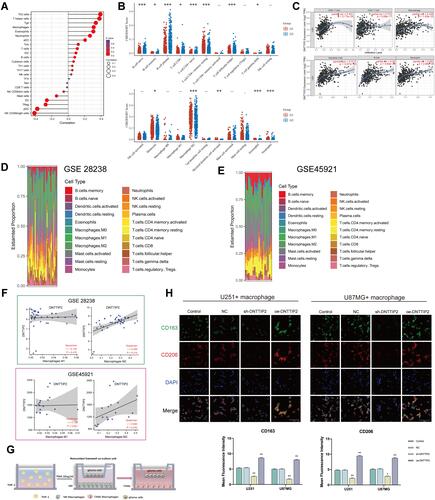
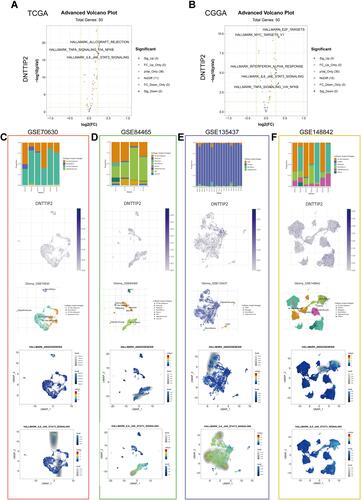
Figure 6 Gene Set Variation Analysis (GSVA) and Single-cell level analysis of DNTTIP2. (A and B) Volcano plot of the differentially enriched genesets in LGG patients with different expression of DNTTIP1/2 in (TCGA) and (CCGA) dataset was analyzed by GSVA ((A) TCGA; (B) CCGA). Blue nodes indicate down-regulation, red indicates up-regulation, yellow indicates significance, and gray indicates non-significance. (C–F) Single-cell analysis of DNTTIP2 based on four single-cell RNA‐seq datasets. (C) GSE70630; (D) GSE84465; (E) GSE135437; (F) GSE148842. Uniform manifold approximation and projection (UMAP) plots illustrating the expression of DNTTIP2 clusters. UMAP plots illustrating the LGG cell landscape. Different cell types across all cells after quality control, dimensionality reduction, and clustering. Enrichment score for genes from the Hallmark gene set in each cell, obtained using gene set variation analysis.