Figures & data
Figure 1 Preoperative Contrast-enhanced CT images and postoperative histology examination of the LGMS specimen. (A). CT images at the initial diagnosis (the lesions are indicated by arrows). (B). The LGMS tumor cells are mainly in a fascicular arrangement, infiltrative growth with unclear boundaries, with light to moderate heteromorphic and mitotic image (magnification, ×10). (C). Immunohistochemical examination shows positive staining for CD117, DOG1 and SMA (magnification, ×10).
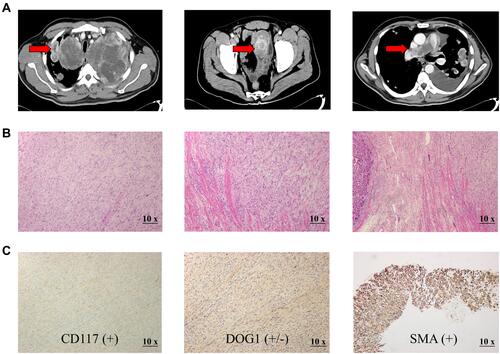
Figure 2 Contrast-enhanced CT images and serum CA125 level changes throughout the apatinib therapy. (A). CT images reveal that the mass grew quickly until apatinib treatment was given. After apatinib treatment, the mass was observably decreases in size one month later and continues to shrink at a follow-up period of 4 months (October 25, 2017); however, the mass increases in size 7 months later (January 4, 2018), liver and pancreas metastasis are detected 8 months later (February 26 2018). (B). Serum CA125 levels continuously increase from 231.3 U/mL (February 21, 2017) to 252.3 U/mL (June 6, 2017) until apatinib treatment is given. After apatinib treatment begins in June 8, 2017, at a follow-up period of one month, serum CA125 levels significantly decrease to 150.8 U/mL (July 27, 2017). Then, apatinib is used as maintenance therapy, and CA125 dramatically decreases to a minimum of 7.1 U/mL (October 25, 2017). Finally, the evaluation indicates PD and the patient’s CA125 increases to 132.7 U/mL again in May 25, 2018.
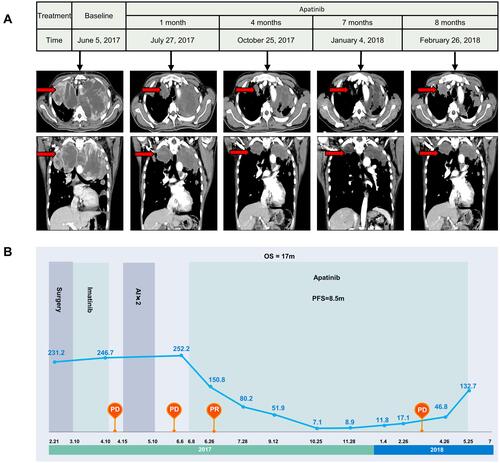
Figure 3 The mutations detected by WES and RNA sequencing. (A). Framework of the bioinformatics analysis of the article. (B). The types of single-nucleotide variations. (C). The chromosomal locations of the copy number variations. The red fragment corresponds to the under-chromosome, which shows CNVs with amplification. In blue, CNVs with deletions are reported. (D). CNV and SNP of patients in the human body. Gene font size is directly proportional to the expression of CNV and SNP, and the color of the gene is random. (E). The distribution of CNV and SNP mutations sites are shown on a human chromosome ideogram. The different types of SNP mutations are annotated under the chromosome. CNV mutations are annotated: red bar, amplification; blue bar, deletion. The chromosome number is indicated at the left of each ideogram. (F). Amino acid axis labels for domain start and stop positions, as well as exact marker locations, are clearly displayed for precision interpretation. (G). Visualization of the predicted chemical interaction between mutation genes. The 3D structure of the protein is modeled using Swiss MODEL. All the structural components of the protein including the Cβ, all atoms, salvation and torsion angles were retrieved from Protein Data Bank (PDB) server. The visualization was drawn using PyMol. (H). Subpathway enrichment analysis of CNV and SNP mutation genes in LGMS patient (P<0.05).
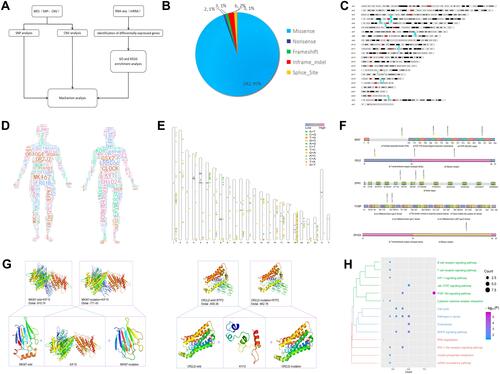
Figure 4 Analyzing the potential mechanism and targets of LGMS by KEGG pathways and gene ontology. (A). Volcanic map of the DEGs: The abscissa represents the log2FC, and the ordinate represents log10 (adjusted P-value). Red dots, blue dots and gray dots show that the expression levels of the DEGs were obviously upregulated, downregulated, or had no significant difference, respectively. (B). KEGG pathway analysis of LGMS. (C). The biological processes of LGMS. (D). GO (biological process) analysis was performed by Clue GO. Different colors of nodes refer to the functional annotation of ontologies. All these genes were discovered to be involved in 23 different biological processes.
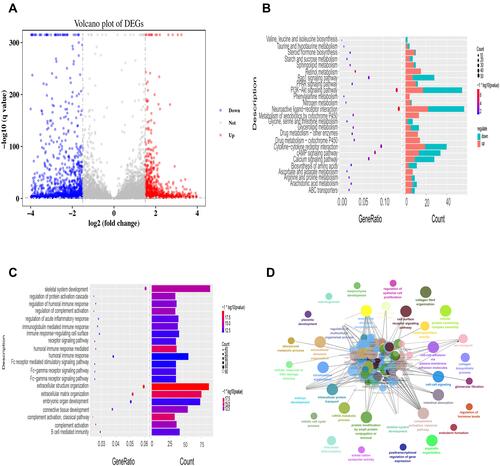
Figure 5 Summary of the clinical features of previously reported LGMS cases.