Figures & data
Figure 1 Flow diagram of the study design. (A) The procedure of selecting AZGP1 as the key gene. (B) AZGP1 expression in rectal samples and its visualization; (a) Box plots of AZGP1 differential expression in radioresistant and radiosensitive CRC samples; (b) The integrated SMD and diagnostic meta-analysis of AZGP1 expression in radioresistant versus radiosensitive CRC samples; (c) Survival analysis in patients with CRC in terms of disease-free survival and overall survival. (C) Target prediction for andrographolide and molecular docking. GEO, Gene Expression Omnibus database; SMD, standard mean difference; TCMSP, traditional Chinese medicine systems pharmacology.
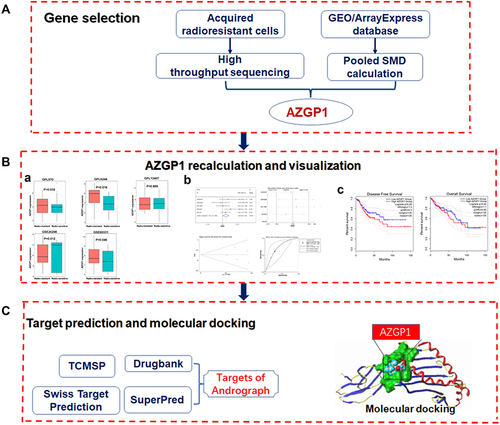
Figure 2 Differentially expressed genes in the acquired radioresistant colorectal cell lines. (A) volcano plots displaying the differentially expressed genes in HCT-116-R cells and HCT-116 cells. (B) volcano plots of the differentially expressed genes in CX-1-R cells versus CX-1 cells. The dark red dots represent the upregulated genes, the deep-blue dots represent the downregulated genes, and the gray dots represent genes with no differential expression. (C) Venn diagrams displaying the upregulated genes in HCT-116-R cells and CX-1-R cells. (D) Venn diagrams displaying the downregulated genes in HCT-116-R cells and CX-1-R cells.
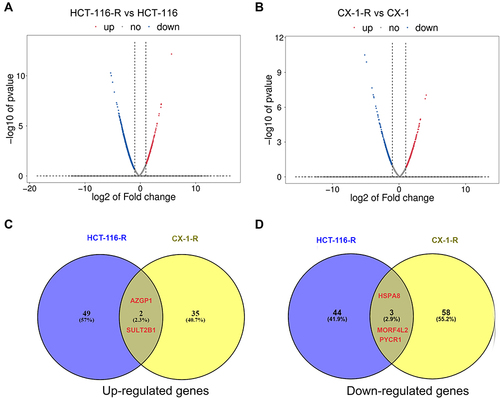
Figure 3 Box plots of AZGP1 differential expression in radioresistant and radiosensitive CRC samples. (A) GPL570 platform containing data from GSE35452 and GSE119409 series; (B) GPL6244 platform containing data from GSE43206 and GSE46862 series; (C) GPL13497 platform containing data from GSE97543 and GSE150082 series; (D) GSE20298 dataset; (E) GSE60331dataset. The Orange boxes represent the expression of AZGP1 in radioresistant samples, while the turquoise boxes represent the expression of AZGP1 in radiosensitive samples.
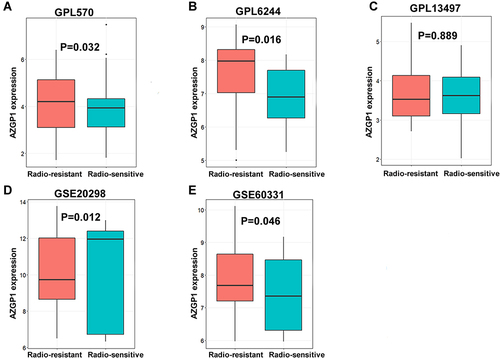
Figure 4 Corresponding ROC curves of AZGP1 differentiated expression in radioresistant versus radiosensitive CRC samples. (A) GPL570 platform containing data from GSE35452 and GSE119409 series; (B) GPL6244 platform containing data from GSE43206 and GSE46862 series; (C) GPL13497 platform containing data from GSE97543 and GSE150082 series; (D) GSE20298 dataset; (E) GSE60331dataset.
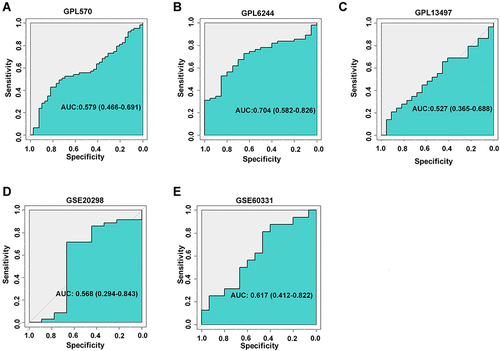
Figure 5 The integrated SMD and diagnostic meta-analysis of AZGP1 expression in radioresistant versus radiosensitive CRC samples. (A) forest plots of SMD values; (B) forest plot of sensitivity analysis; (C) funnel plot; (D) SROC curve of all included studies.
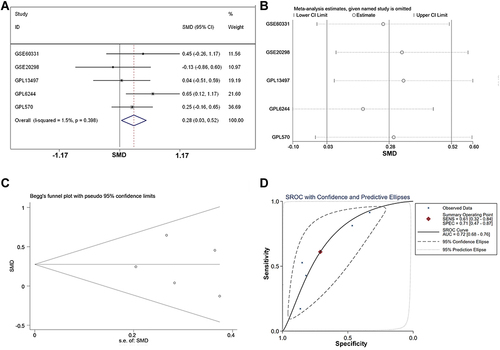
Figure 6 Boxplot of the differentiated expression of AZGP1 in CRC tissue and normal colorectal tissue. (A) GPL96; (B) GPL10558; (C) GPL15207; (D) GSE15781; (E) GSE20842; (F) GSE24713; (G) GSE25071; (H) GSE28000; (I) GSE44076; (J) GSE47063 dataset; (K) GSE87211 dataset; (L) GSE103512 dataset; (M) GSE113513 dataset; (N) GSE115261 dataset; (O) GSE141174 dataset; (P) GSE156355 dataset; (Q) TCGA+CTEx. TCGA, The Cancer Genome Atlas. The Orange boxes represent the expression of AZGP1 in normal colorectal tissue, while the turquoise boxes represent the expression of AZGP1 in CRC tissue.
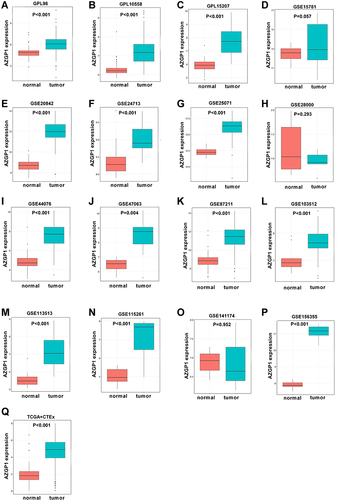
Figure 7 The corresponding ROC curves of AZGP1 differential expression in CRC tissue versus normal colorectal tissue. (A) GPL96; (B) GPL10558; (C) GPL15207; (D) GSE15781 dataset; (E) GSE20842; (F) GSE24713; (G) GSE25071; (H) GSE28000; (I) GSE44076; (J) GSE47063; (K) GSE87211; (L) GSE103512; (M) GSE113513; (N) GSE115261; (O) GSE141174; (P) GSE156355; (Q) TCGA+CTEx. TCGA, The Cancer Genome Atlas.
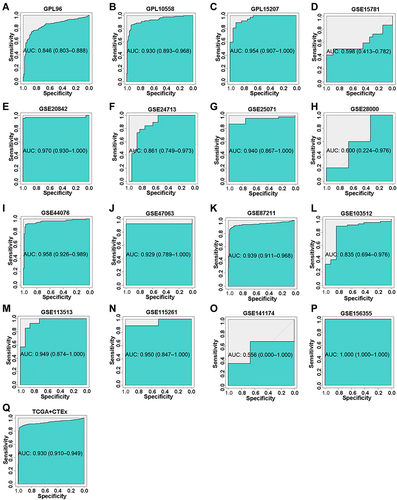
Figure 8 The integrated SMD and diagnostic meta-analysis of AZGP1 expression in CRC tissue versus normal colorectal tissue. (A) forest plots of SMD values; (B) forest plot of sensitivity analysis; (C) funnel plot; (D) SROC curve of the included studies.
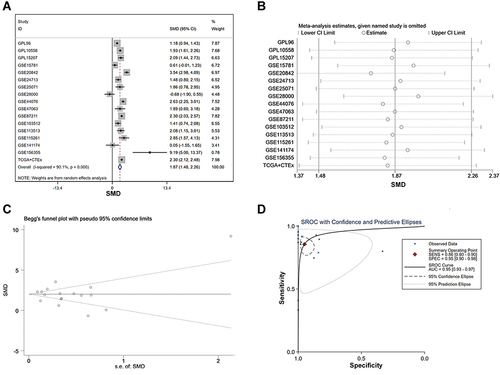
Figure 9 AZGP1 expression in normal tissue and colorectal cancer tissue from the Human Protein Atlas database [antibody CAB016087]. (A) Female, age 56. Patient ID 3343. Normal small intestine (T-65000) tissue, NOS(M-00100), low expression of AZGP1. The relative results of glandular cells are as follows: staining: low; intensity: moderate; quantity: <25%; location: cytoplasmic/membranous. (B) Female, age 56. Patient ID 1423. Normal colon (T-67000) tissue, NOS(M-0010), deficient expression of AZGP1. The relative results of glandular cells are as follows: staining: not detected; intensity: negative; quantity: none; location: none. (C) Female, age 66. Patient ID 2060. Normal rectum (T-68000) tissue, NOS(M-00100), deficient expression of AZGP1. The relative results of glandular cells are as follows: staining: not detected; intensity: negative; quantity: none; location: none. (D) Male, age 51. Patient ID 3298. Rectum (T-68000) adenocarcinoma, NOS(M-81403), moderate expression of AZGP1. The relative results of tumor cells are as follows: staining: medium; intensity: moderate; quantity: 75%–25%; location: cytoplasmic/membranous.
![Figure 9 AZGP1 expression in normal tissue and colorectal cancer tissue from the Human Protein Atlas database [antibody CAB016087]. (A) Female, age 56. Patient ID 3343. Normal small intestine (T-65000) tissue, NOS(M-00100), low expression of AZGP1. The relative results of glandular cells are as follows: staining: low; intensity: moderate; quantity: <25%; location: cytoplasmic/membranous. (B) Female, age 56. Patient ID 1423. Normal colon (T-67000) tissue, NOS(M-0010), deficient expression of AZGP1. The relative results of glandular cells are as follows: staining: not detected; intensity: negative; quantity: none; location: none. (C) Female, age 66. Patient ID 2060. Normal rectum (T-68000) tissue, NOS(M-00100), deficient expression of AZGP1. The relative results of glandular cells are as follows: staining: not detected; intensity: negative; quantity: none; location: none. (D) Male, age 51. Patient ID 3298. Rectum (T-68000) adenocarcinoma, NOS(M-81403), moderate expression of AZGP1. The relative results of tumor cells are as follows: staining: medium; intensity: moderate; quantity: 75%–25%; location: cytoplasmic/membranous.](/cms/asset/11976def-d6a6-4e15-9384-0571b4af6360/dpgp_a_12153416_f0009_c.jpg)
Figure 10 Survival analysis in patients with CRC in terms of disease-free survival and overall survival. (A) Kaplan-Meier curves for disease-free survival; (B) Kaplan-Meier curves for overall survival.
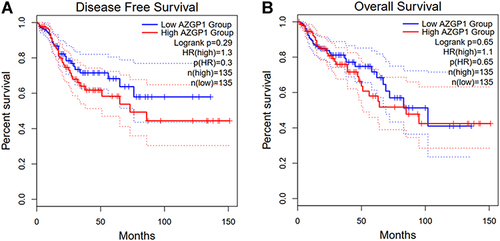
Figure 11 Venn diagrams for the intersections between genes acting on andrographolide and radiotherapy-resistance related genes in colorectal cancer. The 209 andrographolide targets from the different databases and text mining, and the overlapping targets were AZGP1 and SULT2B1.
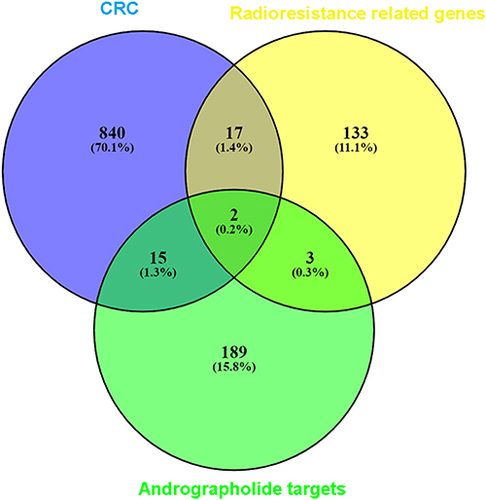
Figure 12 Gene ontology (GO) enrichment and KEGG pathway annotations of the 209 genes related to andrographolide. (A) histogram of GO enrichment; (B) histogram of GO enrichment of KEGG pathway. The GO analysis was conducted using R package cluster Profiler and visualized using R package GOplot.
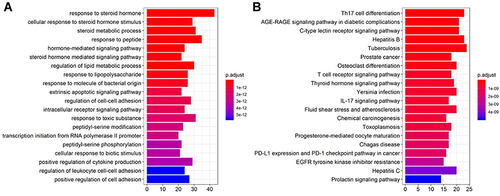
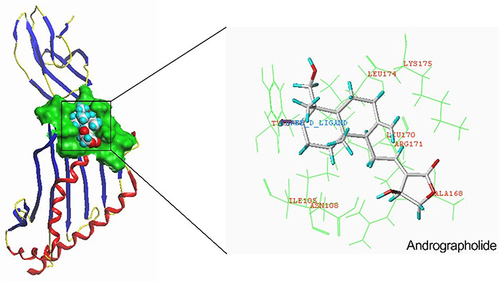
Figure 13 Molecular docking of andrographolide with AZGP1. Schematic diagram of binding of andrographolide with AZGP1 (total score = 7.0941).