Figures & data
Table 1 Demographic and Clinical Data of Alcohol-Induced ONFH Cases and Healthy Controls
Table 2 The Information of Selected Variants in PFKP and GPC6 Genes
Table 3 Association Analysis of PFKP and GPC6 Polymorphisms with Alcohol-Induced ONFH Susceptibility in Genetic Models
Table 4 FPRP Analysis for the Significant Associations of ARRDC3 SNPs with Glioma Risk
Table 5 Association Analysis Between GPC6 Polymorphisms and Alcohol-Induced ONFH Susceptibility in ≤42 Years Group
Table 6 Association Analysis Between PFKP and GPC6 Polymorphisms and Alcohol-Induced ONFH Susceptibility After Necrotic Site Stratification Analysis
Figure 1 Haplotype block map of PFKP variants. The numbers inside the diamonds indicate the D′ for pairwise analyses.
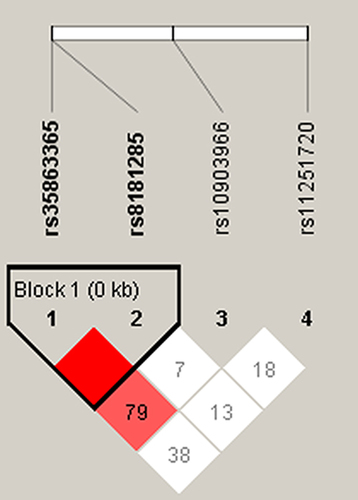
Figure 2 Haplotype block map of GPC6 variants. The numbers inside the diamonds indicate the D′ for pairwise analyses.
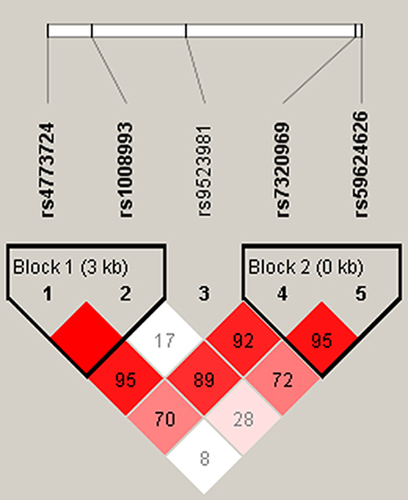
Figure 3 Multifactor dimensionality reduction (MDR) was completed to detect the interaction between SNPs in PFKP and GPC6 genes to predict the alcohol-induced ONFH risk.
Figure 4 The interacting genes of PFKP and GPC6 were displayed by String software.
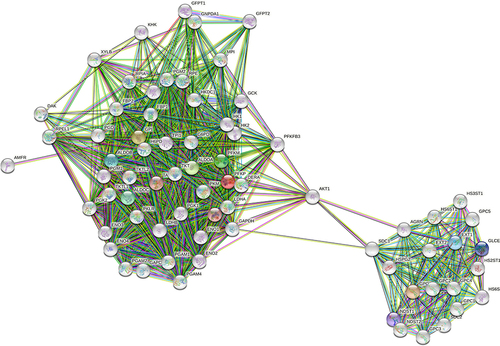
Figure 5 The results of the top 10 GO pathways of the interacting genes of PFKP and GPC6. (A) Bubble plot of BP, (B) Bubble plot of MF, (C)Bubble plot of CC.
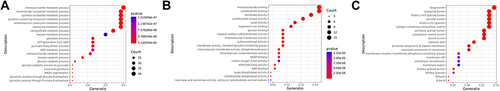
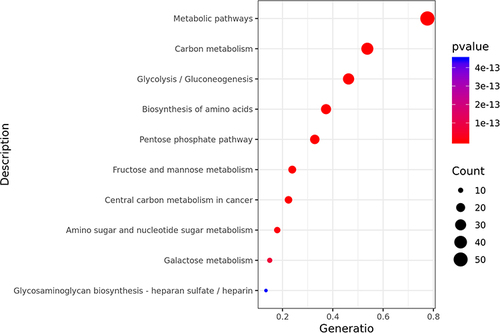
Figure 6 The results of the top 10 KEGG pathways of the interacting genes of PFKP and GPC6.