
Figures & data
Table 1 Primer Sequences for the Full-Length CYP2E1 Gene Amplification
Figure 1 Graphical representation of the PCR fragment position in the reference CYP2E1 gene. The exons are indicated by green boxes. Names of the seven primer pairs used to generate the PCR fragments are indicated.
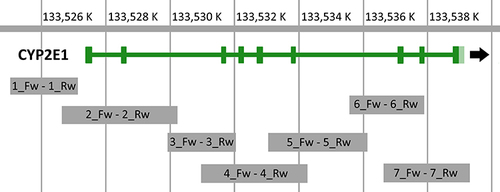
Table 2 Sequencing Data Quality for the Study Sample Set (n = 3)
Figure 2 Visualization of PCR products of the seven primer pairs amplifying full-length CYP2E1 gene for the test samples (n=3) by agarose gel electrophoresis. (A) PCR products of the primer pairs Nr. 1, 2 and 3. (B) PCR products of the primer pair Nr. 4. (C) PCR products of the primer pairs Nr. 5, 6 and 7. Names of the primer pairs used to generate the PCR fragments are indicated. M – DNA molecular weight marker GeneRuler 1 kb DNA ladder (Thermo Fisher Scientific Baltics, UAB, Lithuania); size of the three reference bands (6000, 3000 and 1000 bp) is indicated; 30, 32 and 33 – test DNA samples.
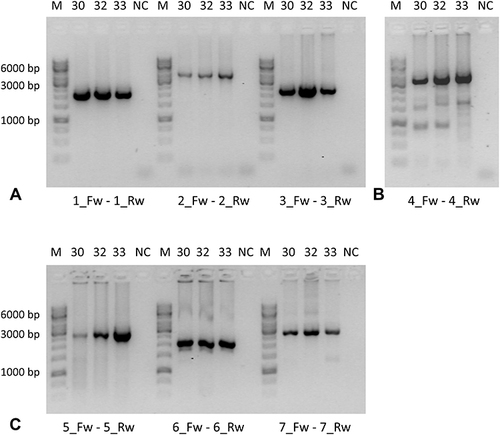
Table 3 Classification of the Identified Single Nucleotide Variants